Reasoning Aptitude > Data Interpretation
BAR GRAPH MCQs
Bar Charts
Total Questions : 165
| Page 3 of 17 pages
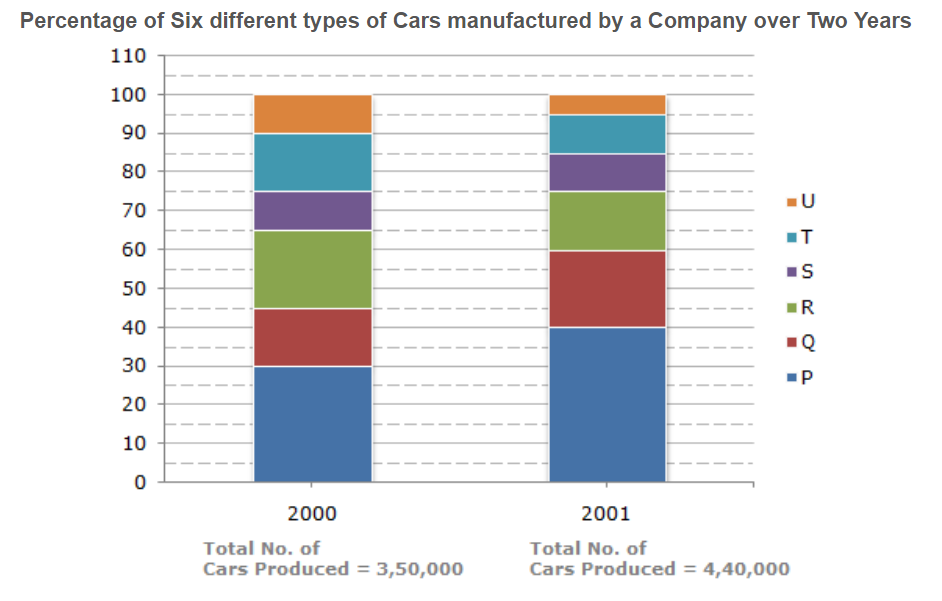
Question 21. The bar graph given below shows the percentage distribution of the total production of a car manufacturing company into various models over two years.
If the percentage production of P type cars in 2001 was the same as that in 2000, then the number of P type cars produced in 2001 would have been?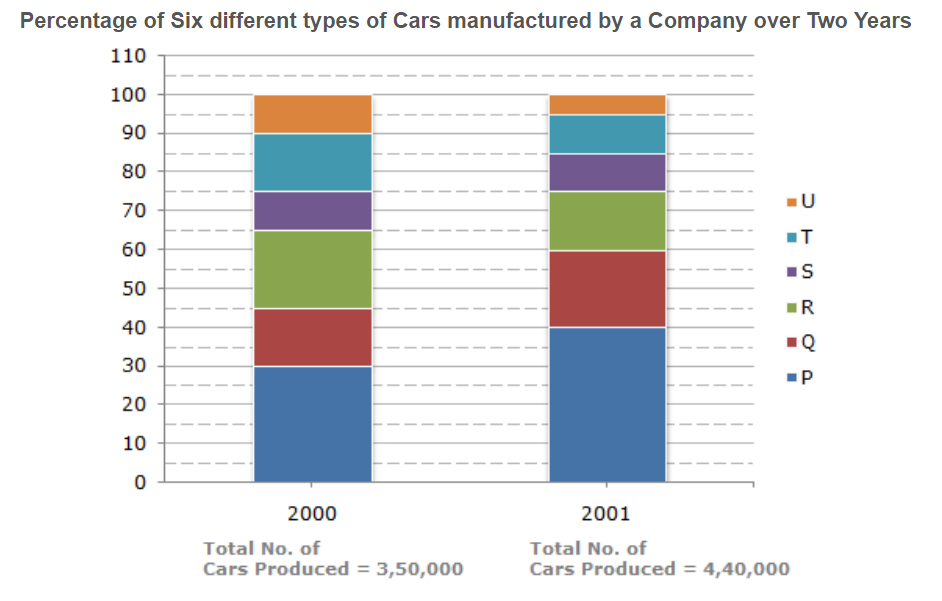
If the percentage production of P type cars in 2001 was the same as that in 2000, then the number of P type cars produced in 2001 would have been?

Answer: Option B. -> 1,32,000
Answer: (b).1,32,000
Answer: (b).1,32,000
Answer: Option B. -> R
Answer: (b).R
Answer: (b).R
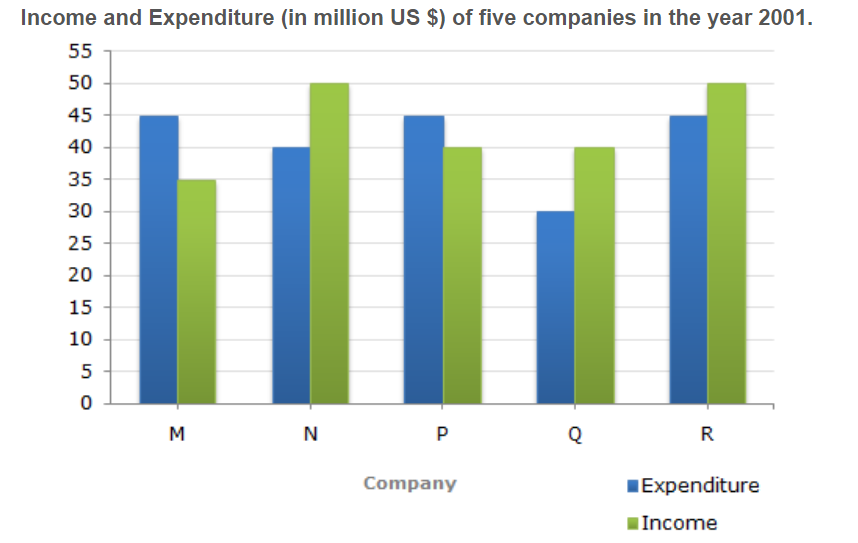
Question 23. The following bar graph shows the Income and Expenditures (in million US $) of five companies in the year 2001. The percent profit or loss of a company is given by
% Profit/Loss =(Income - Expenditure)/Expenditurex 100
For Company R, if the expenditure had increased by 20% in year 2001 from year 2000 and the company had earned profit of 10% in 2000, what was the Company's income in 2000 (in million US $)?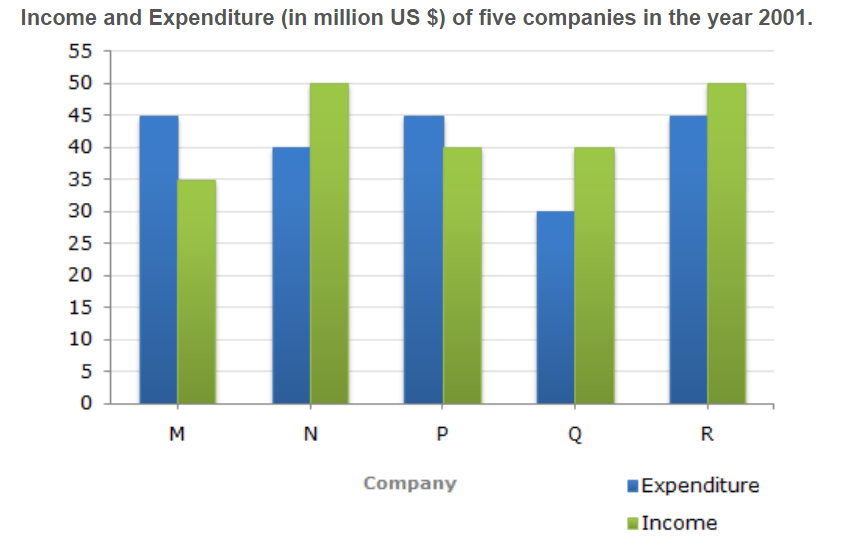
% Profit/Loss =(Income - Expenditure)/Expenditurex 100
For Company R, if the expenditure had increased by 20% in year 2001 from year 2000 and the company had earned profit of 10% in 2000, what was the Company's income in 2000 (in million US $)?

Answer: Option D. -> 41.25
Answer: (d).41.25
Answer: (d).41.25
Answer: Option D. -> There was no loss or profit
Answer: (d).There was no loss or profit
Answer: (d).There was no loss or profit
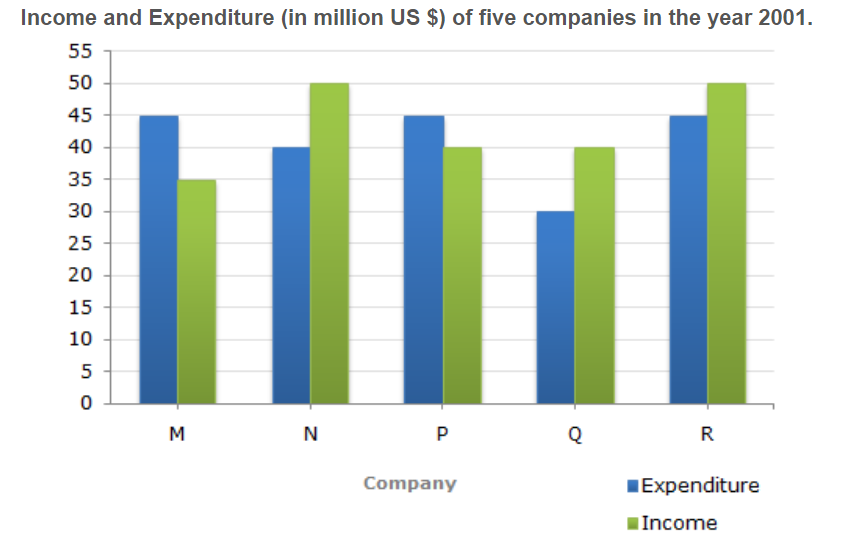
Question 25. The following bar graph shows the Income and Expenditures (in million US $) of five companies in the year 2001. The percent profit or loss of a company is given by
% Profit/Loss =(Income - Expenditure)/Expenditurex 100
In 2001, what was the approximate percentage of profit/loss of all the five Companies taken together?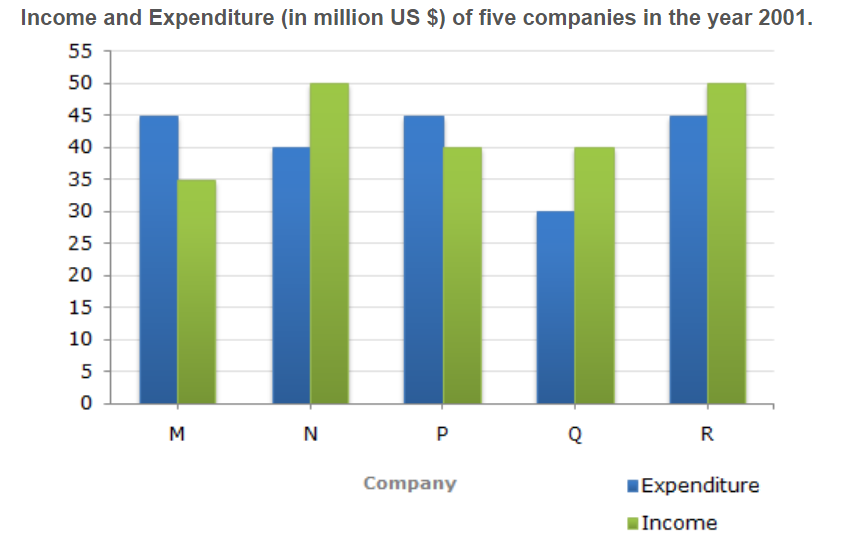
% Profit/Loss =(Income - Expenditure)/Expenditurex 100
In 2001, what was the approximate percentage of profit/loss of all the five Companies taken together?

Answer: Option A. -> 5% profit
Answer: (a).5% profit
Answer: (a).5% profit
Answer: Option D. -> Q
Answer: (d).Q
Answer: (d).Q
Answer: Option D. -> 18,000 units
Answer: (d).18,000 units
Answer: (d).18,000 units
Question 28. The following bar graph shows the Income and Expenditures (in million US $) of five companies in the year 2001. The percent profit or loss of a company is given by
% Profit/Loss =(Income - Expenditure)/Expenditurex 100
If the income of Company Q in 2001 was 10% more than its income in 2000 and the Company had earned a profit of 20% in 2000, then its expenditure in 2000 (in million US $) was?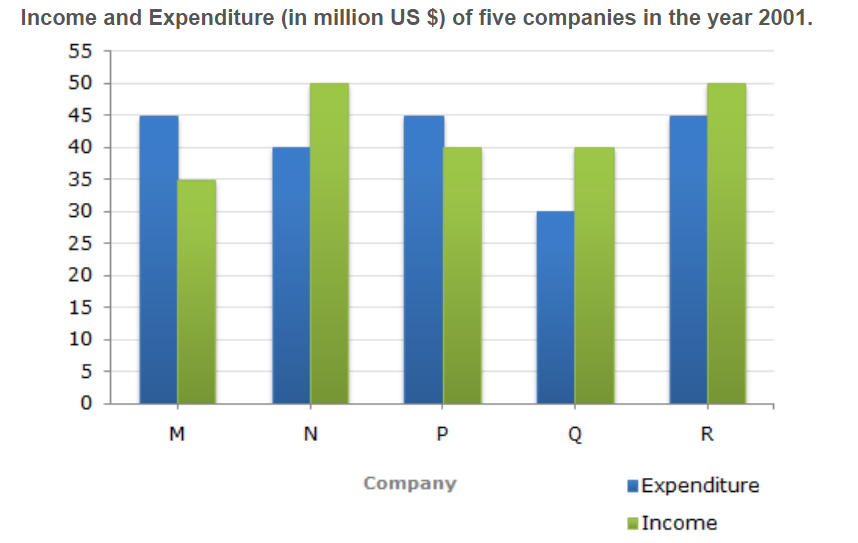
% Profit/Loss =(Income - Expenditure)/Expenditurex 100
If the income of Company Q in 2001 was 10% more than its income in 2000 and the Company had earned a profit of 20% in 2000, then its expenditure in 2000 (in million US $) was?

Answer: Option B. -> 30.30
Answer: (b).30.30
Answer: (b).30.30
Answer: Option C. -> Both option a and b
Answer: (c).Both option a and b
Answer: (c).Both option a and b
Answer: Option C. -> 122 %
Answer: (c).122 %
Answer: (c).122 %

