Reasoning Aptitude > Data Interpretation
BAR GRAPH MCQs
Bar Charts
Total Questions : 165
| Page 16 of 17 pages
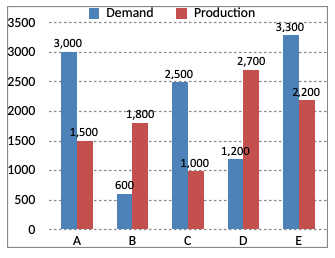
Answer: Option C. -> 3 : 2
Number of companies having more demand than production = 3
Number of companies having more production than demand = 2
∴ Required ratio
= 3 : 2
Number of companies having more demand than production = 3
Number of companies having more production than demand = 2
∴ Required ratio
= 3 : 2
Question 152. Directions (1 - 5): Study the following graph carefully and answer the questions that follow:
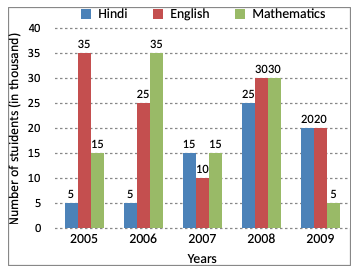
The total number of students who opted for Mathematics in the years 2005 and 2008 together is approximately what percent of the total number of students who opted for all three subjects in the same years?

The total number of students who opted for Mathematics in the years 2005 and 2008 together is approximately what percent of the total number of students who opted for all three subjects in the same years?
Answer: Option D. -> 32%
Number of students opting Mathematics in 2005 and 2008
= 15000 + 30000
= 45000
Number of students opting for these three subjects in 2005 and 2008
= {(5 + 35 + 15) + (25 + 30 + 30)} thousands
= 55000 + 85000
= 140000
$$\eqalign{
& \text{Required %} \cr
& = \left(\frac{45000}{140000}\times100\right)\% \cr
& = \frac{225}{7}\% \cr
& = 32.14\% \cr
& \approx 32\% \cr} $$
Answer: Option D. -> Cannot be determined
Number of students who opted for the given three subjects in the year 2009 is
= 20000 + 20000 + 5000
= 45000
Number of girls = 38% of 45000
= 45000 × $$\frac{38}{100}$$
= 17100
Out of these, the number of boys who opted for Mathematics cannot be found.
Number of students who opted for the given three subjects in the year 2009 is
= 20000 + 20000 + 5000
= 45000
Number of girls = 38% of 45000
= 45000 × $$\frac{38}{100}$$
= 17100
Out of these, the number of boys who opted for Mathematics cannot be found.
Answer: Option D. -> 96000
Number of students who opted Hindi and Mathematics in 2006, 2007 and 2009
= {(5 + 35) + (15 + 15) + (20 + 5)} thousands
= 95000
Number of students who opted Hindi and Mathematics in 2006, 2007 and 2009
= {(5 + 35) + (15 + 15) + (20 + 5)} thousands
= 95000
Question 155. Directions (1 - 5): Study the following graph carefully and answer the questions that follow:
If the total number of students in the university in the year 2007 was 455030, the total number of students who opted for the given three subjects was approximately what percent of the total students?

If the total number of students in the university in the year 2007 was 455030, the total number of students who opted for the given three subjects was approximately what percent of the total students?
Answer: Option B. -> 9%
In 2007, we have:
Total number of students = 455030
Number of those choosing the given three subjects
= 15000 + 10000 + 15000
= 40000
∴ Required percentage
$$\eqalign{
& = \left(\frac{40000}{455030}\times100\right)\% \cr
& = 8.79\% \cr
& \approx 9\% \cr} $$
In 2007, we have:
Total number of students = 455030
Number of those choosing the given three subjects
= 15000 + 10000 + 15000
= 40000
∴ Required percentage
$$\eqalign{
& = \left(\frac{40000}{455030}\times100\right)\% \cr
& = 8.79\% \cr
& \approx 9\% \cr} $$
Answer: Option A. -> 11 : 5
Ratio of the number who opted for English in 2006 and 2008 to the number who opted for Hindi in 2005 and 2009
= (25 + 30) : (5 + 20)
= 55 : 25
= 11 : 5
Ratio of the number who opted for English in 2006 and 2008 to the number who opted for Hindi in 2005 and 2009
= (25 + 30) : (5 + 20)
= 55 : 25
= 11 : 5
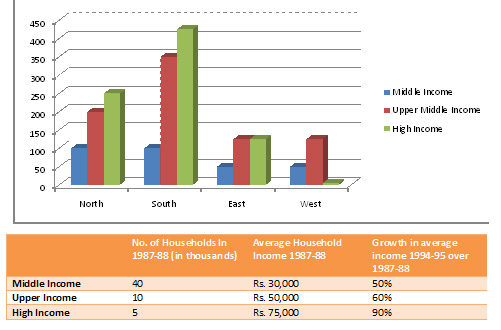
Question 157. Directions (1 - 4) The following bar chart gives the growth percentage in the number of households in middle, upper-middle and high-income categories in the four regions for the period between 1987-88 and 1994-95.
What is the percentage increase in total number of households for the northern region (upper-middle) over the given period ?

What is the percentage increase in total number of households for the northern region (upper-middle) over the given period ?
Answer: Option B. -> 200%
The percentage increase in total number of households for the northern region for upper-middle income category is 200%.
The percentage increase in total number of households for the northern region for upper-middle income category is 200%.
Question 158. Directions (1 - 4) The following bar chart gives the growth percentage in the number of households in middle, upper-middle and high-income categories in the four regions for the period between 1987-88 and 1994-95.
What was the total household income in northern region for upper-middle class ?

What was the total household income in northern region for upper-middle class ?
Answer: Option D. -> Cannot determined
Region wise breakup is not available. hence, question cannot be answered.
Region wise breakup is not available. hence, question cannot be answered.
Question 159. Directions (1 - 4) The following bar chart gives the growth percentage in the number of households in middle, upper-middle and high-income categories in the four regions for the period between 1987-88 and 1994-95.
Which region showed the highest growth in number of households in all the income categories for the period ?

Which region showed the highest growth in number of households in all the income categories for the period ?
Answer: Option B. -> South
From graph it is clear that southern region showed the highest growth in number of households in all the income categories for the period.
From graph it is clear that southern region showed the highest growth in number of households in all the income categories for the period.
Answer: Option A. -> Rs. 75,000
It is clear from the table average income is Rs. 75,000.
It is clear from the table average income is Rs. 75,000.


