Sail E0 Webinar

Reasoning Aptitude > Data Interpretation

BAR GRAPH MCQs

Bar Charts

Total Questions : 165 | Page 4 of 17 pages
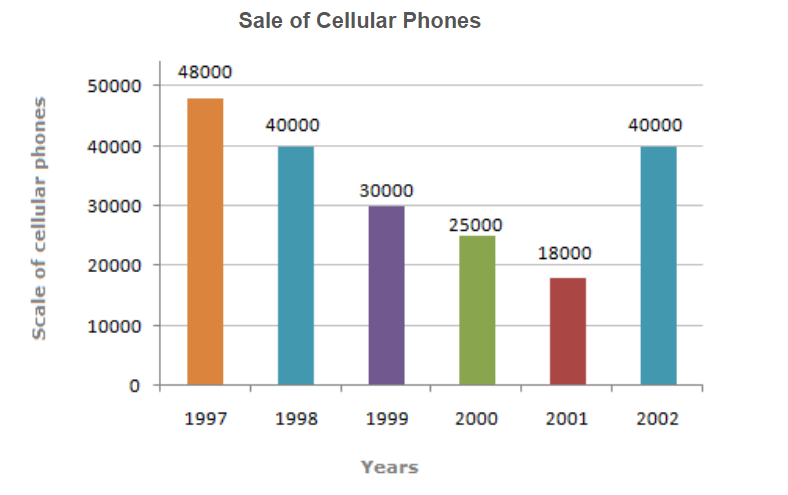
Question 31. Study the bar chart and answer the questions.
The sum of sales of cellular phones in the years 1999 and 2001 is equal to that in ?Study The Bar Chart And Answer The Questions.The Sum Of Sale...
  1.    1997
  2.    1998
  3.    2000
  4.    2002
 Discuss Question
Answer: Option A. -> 1997
Answer: (a).1997
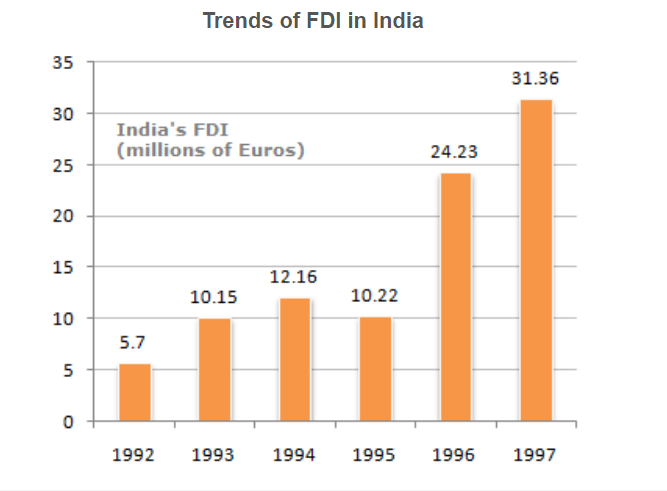
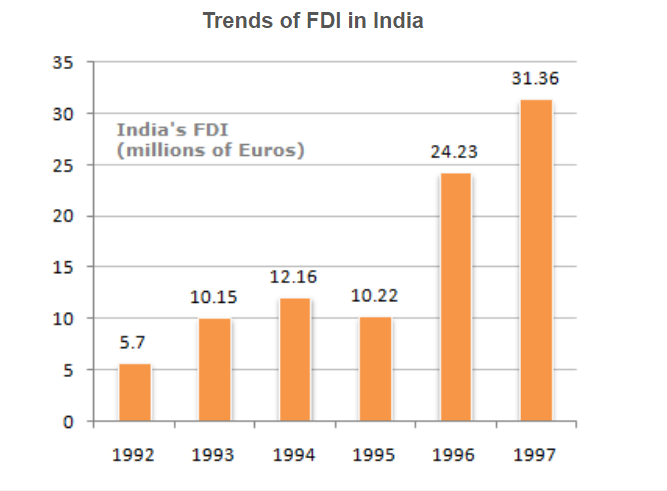
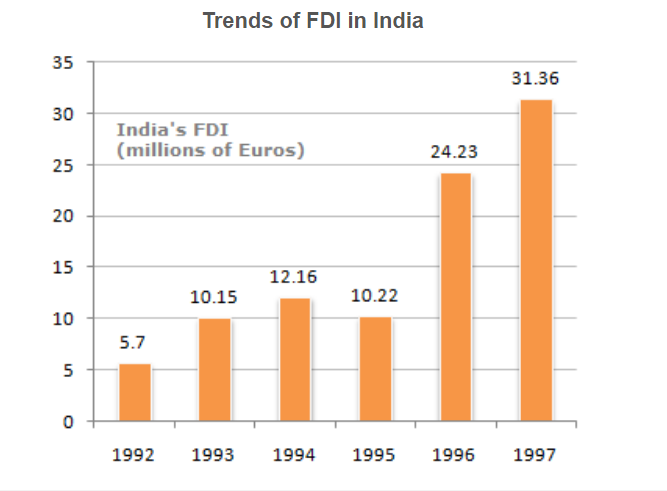
Question 32. The following bar chart shows the trends of foreign direct investments (FDI) into India from all over the world.
What was the ratio of investment in 1997 over the investment in 1992 ?The Following Bar Chart Shows The Trends Of Foreign Direct I...
  1.    5.50
  2.    5.36
  3.    5.64
  4.    5.75
 Discuss Question
Answer: Option A. -> 5.50
Answer: (a).5.50
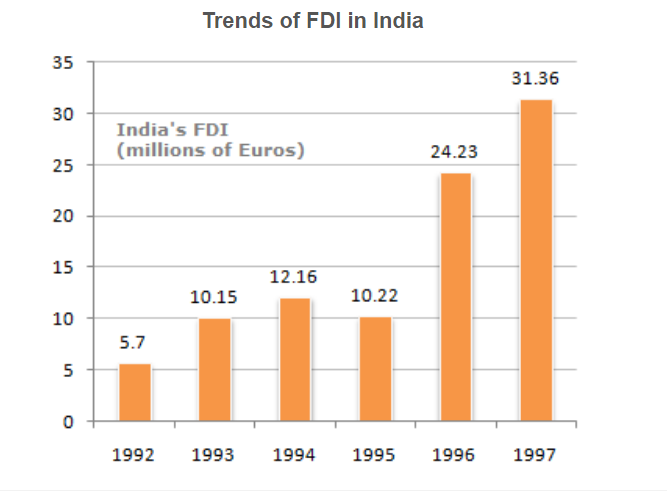
Question 33. The following bar chart shows the trends of foreign direct investments(FDI) into India from all over the world.
What was India's total FDI for the period shown in the figure ?The Following Bar Chart Shows The Trends Of Foreign Direct I...
  1.    93.82
  2.    93.22
  3.    93.19
  4.    None of these
 Discuss Question
Answer: Option A. -> 93.82
Answer: (a).93.82
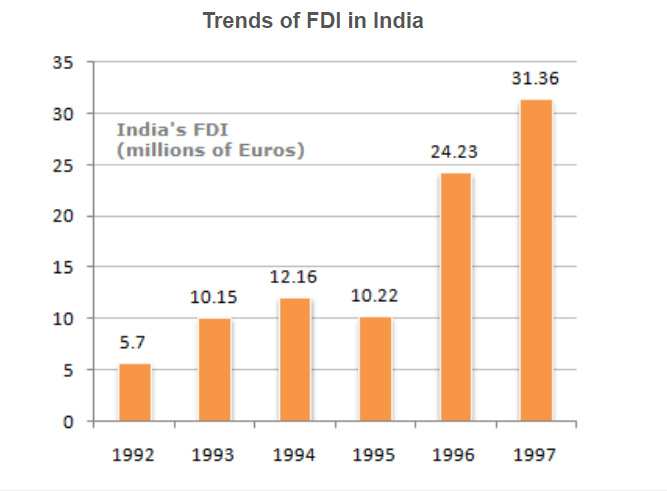
Question 34. The following bar chart shows the trends of foreign direct investments(FDI) into India from all over the world.
What was absolute difference in the FDI to India in between 1996 and 1997 ?The Following Bar Chart Shows The Trends Of Foreign Direct I...
  1.    7.29
  2.    7.13
  3.    8.13
  4.    None of these
 Discuss Question
Answer: Option B. -> 7.13
Answer: (b).7.13
Question 35. The following bar chart shows the trends of foreign direct investments(FDI) into India from all over the world.
Which year exhibited the highest growth in FDI in India over the period shown ?The Following Bar Chart Shows The Trends Of Foreign Direct I...
  1.    1993
  2.    1994
  3.    1995
  4.    1996
 Discuss Question
Answer: Option D. -> 1996
Answer: (d).1996
Question 36. The following bar chart shows the trends of foreign direct investments(FDI) into India from all over the world.
If India FDI from OPEC countries was proportionately the same in 1992 and 1997 as the total FDI from all over the world and if the FDI in 1992 from the OPEC countries was Euro 2 million. What was the amount of FDI from the OPEC countries in 1997 ?The Following Bar Chart Shows The Trends Of Foreign Direct I...
  1.    11
  2.    10.72
  3.    11.28
  4.    11.5
 Discuss Question
Answer: Option A. -> 11
Answer: (a).11
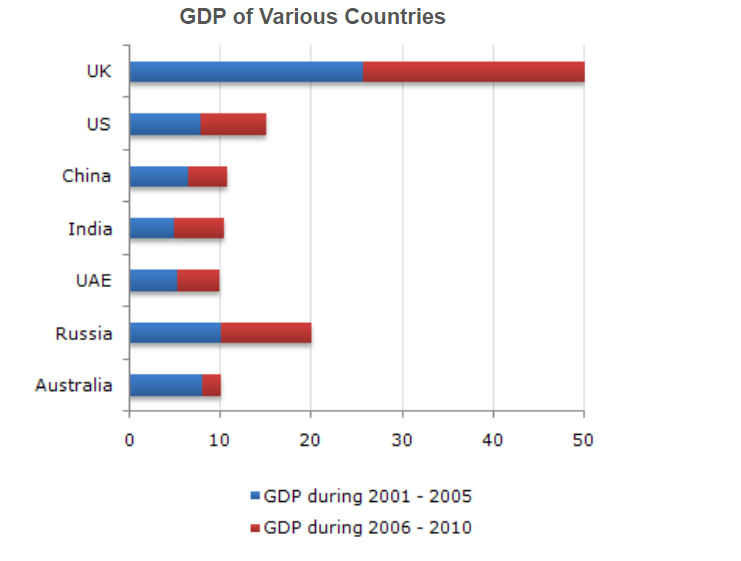
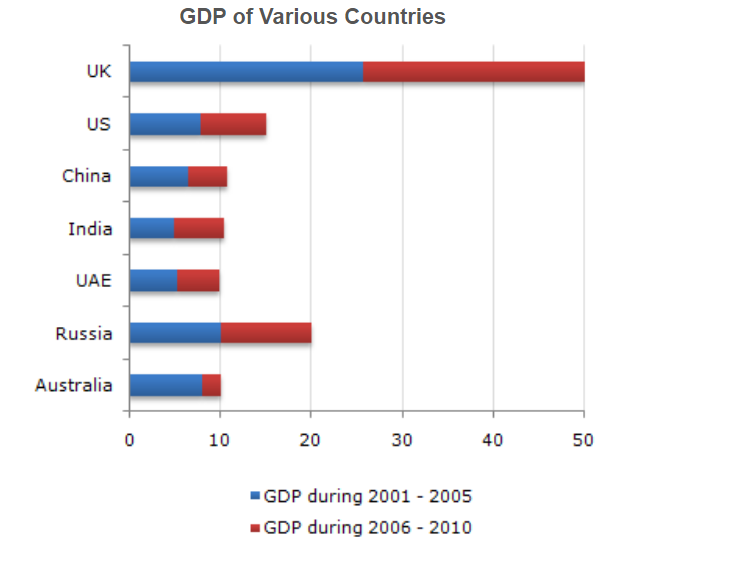
Question 37. The following bar chart represents the GDP of different countries during the half decades 2001 - 2005 and 2006 - 2010. All figures are in Rs. billion.
Which of the countries listed below accounts for the maximum GDP during the half decade 2006 to 2010 ?The Following Bar Chart Represents The GDP Of Different Coun...
  1.    UAE
  2.    US
  3.    India
  4.    China
 Discuss Question
Answer: Option B. -> US
Answer: (b).US
Question 38. The following bar chart represents the GDP of different countries during the half decades 2001 - 2005 and 2006 - 2010. All figures are in Rs. billion.
Which of the countries listed below accounts for the highest GDP during the half decade 2001 to 2005 ?The Following Bar Chart Represents The GDP Of Different Coun...
  1.    Russia
  2.    China
  3.    India
  4.    UAE
 Discuss Question
Answer: Option A. -> Russia
Answer: (a).Russia
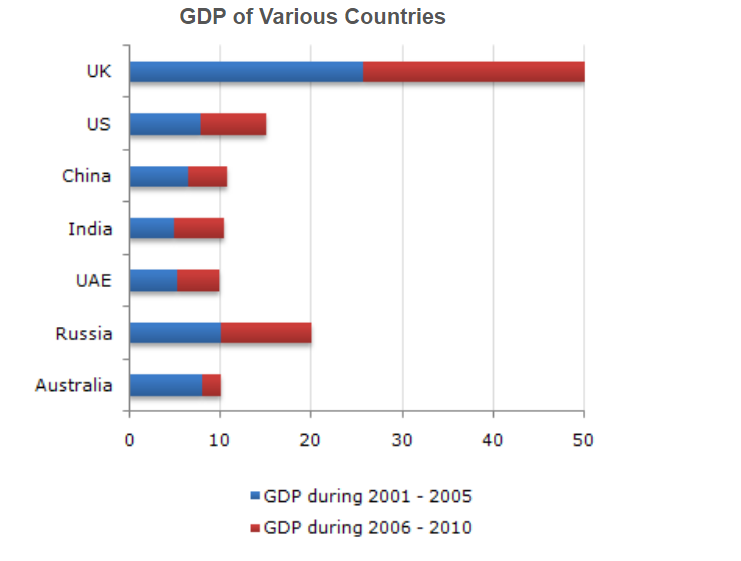
Question 39. The following bar chart represents the GDP of different countries during the half decades 2001 - 2005 and 2006 - 2010. All figures are in Rs. billion.
Out of every Rs. 10,000 spent during the decade 2001 - 2010 approximately how much was the GDP of Russia during the half decade 2001 - 2005 ?The Following Bar Chart Represents The GDP Of Different Coun...
  1.    Rs. 700
  2.    Rs. 1,400
  3.    Rs. 2,800
  4.    None of these
 Discuss Question
Answer: Option D. -> None of these
Answer: (d).None of these
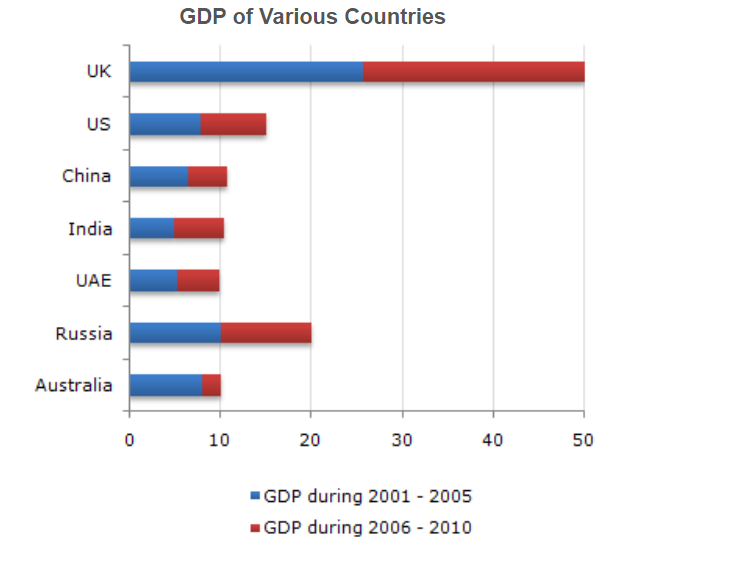
Question 40. The following bar chart represents the GDP of different countries during the half decades 2001 - 2005 and 2006 - 2010. All figures are in Rs. billion.
The GDP of UAE is what fraction of GDP of the UK for the decade (approximately) ?The Following Bar Chart Represents The GDP Of Different Coun...
  1.    (1/4)th
  2.    (1/5)th
  3.    (1/6)th
  4.    Data inadequate
 Discuss Question
Answer: Option B. -> (1/5)th
Answer: (b).(1/5)th

Latest Videos

Latest Test Papers