Sail E0 Webinar

Reasoning Aptitude > Data Interpretation

BAR GRAPH MCQs

Bar Charts

Total Questions : 165 | Page 2 of 17 pages
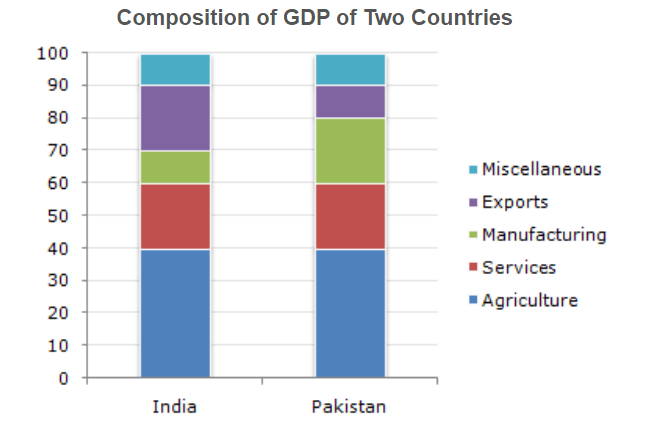
Question 11. The following bar chart shows the composition of the GDP two countries (India and Pakistan).
If the total GDP is the same for both the countries, then what percentage is Pakistan's income through agriculture over India's income through Services ?The Following Bar Chart Shows The Composition Of The GDP Two...
  1.    100 %
  2.    200 %
  3.    133.33 %
  4.    None of these
 Discuss Question
Answer: Option A. -> 100 %
Answer: (a).100 %
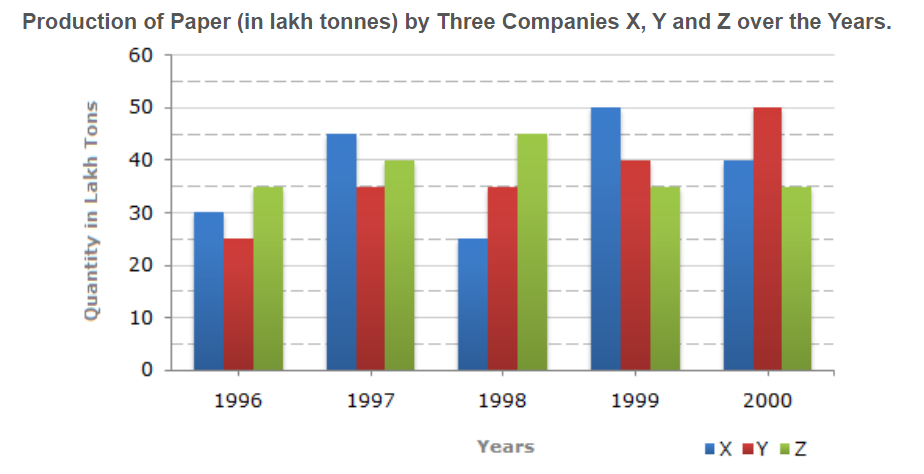
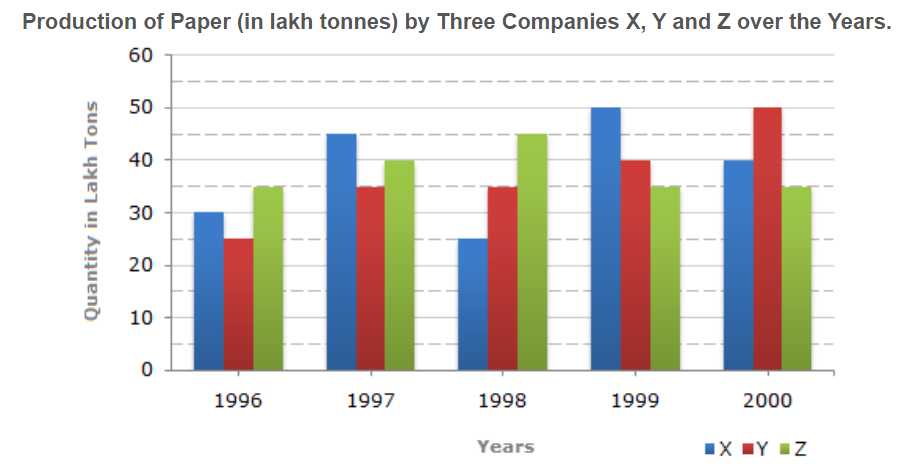
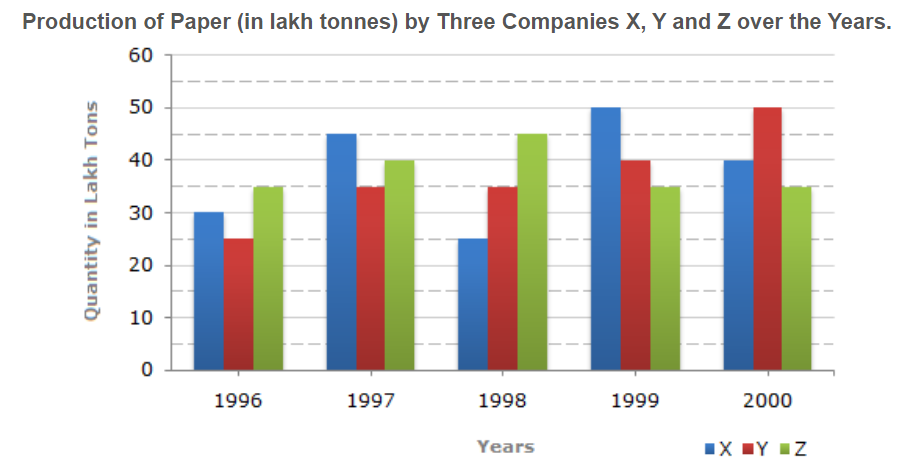
Question 12. The bar graph given below shows the data of the production of paper (in lakh tonnes) by three different companies X, Y and Z over the years.
For which of the following years, the percentage rise/fall in production from the previous year is the maximum for Company Y?The Bar Graph Given Below Shows The Data Of The Production O...
  1.    1997
  2.    1998
  3.    1999
  4.    2000
 Discuss Question
Answer: Option A. -> 1997
Answer: (a).1997
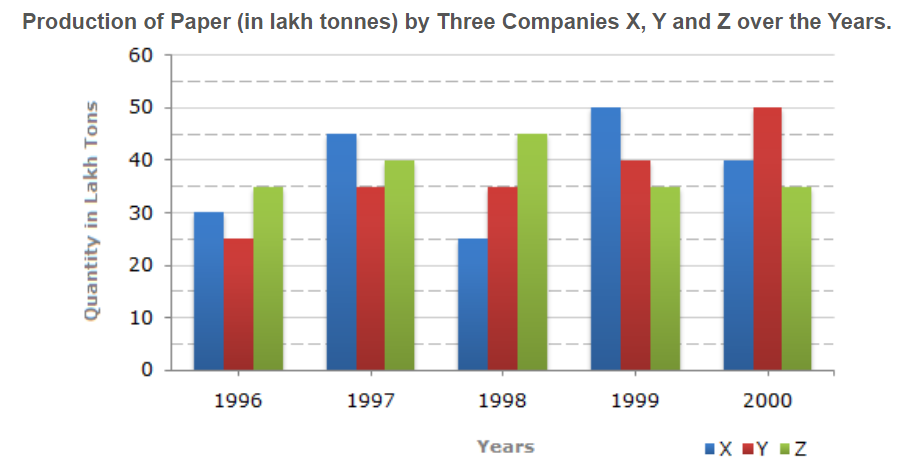
Question 13. The bar graph given below shows the data of the production of paper (in lakh tonnes) by three different companies X, Y and Z over the years.
What is the ratio of the average production of Company X in the period 1998-2000 to the average production of Company Y in the same period?The Bar Graph Given Below Shows The Data Of The Production O...
  1.    1:1
  2.    15:17
  3.    23:25
  4.    27:29
 Discuss Question
Answer: Option C. -> 23:25
Answer: (c).23:25
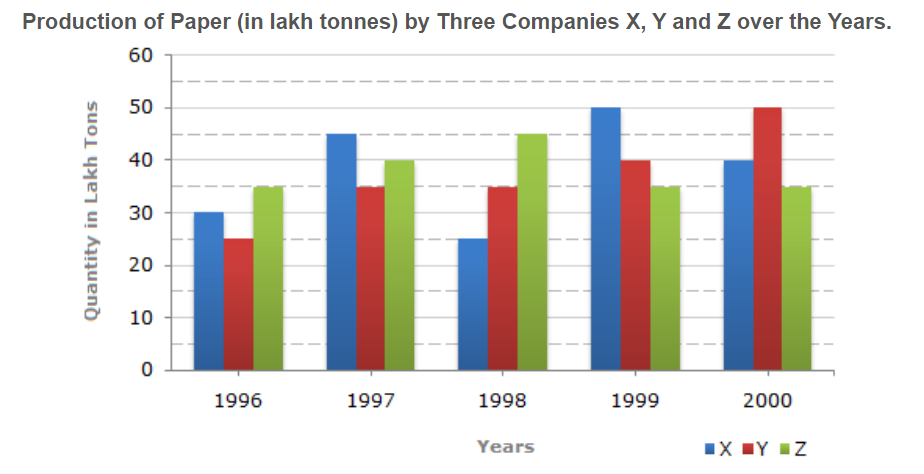
Question 14. The bar graph given below shows the data of the production of paper (in lakh tonnes) by three different companies X, Y and Z over the years.
The average production for five years was maximum for which company?The Bar Graph Given Below Shows The Data Of The Production O...
  1.    X
  2.    Y
  3.    Z
  4.    X and Z both
 Discuss Question
Answer: Option D. -> X and Z both
Answer: (d).X and Z both
Question 15. The bar graph given below shows the data of the production of paper (in lakh tonnes) by three different companies X, Y and Z over the years.
In which year was the percentage of production of Company Z to the production of Company Y the maximum?The Bar Graph Given Below Shows The Data Of The Production O...
  1.    1996
  2.    1997
  3.    1998
  4.    1999
 Discuss Question
Answer: Option A. -> 1996
Answer: (a).1996
Question 16. The bar graph given below shows the data of the production of paper (in lakh tonnes) by three different companies X, Y and Z over the years.
What is the percentage increase in the production of Company Y from 1996 to 1999?The Bar Graph Given Below Shows The Data Of The Production O...
  1.    30%
  2.    45%
  3.    50%
  4.    60%
 Discuss Question
Answer: Option D. -> 60%
Answer: (d).60%
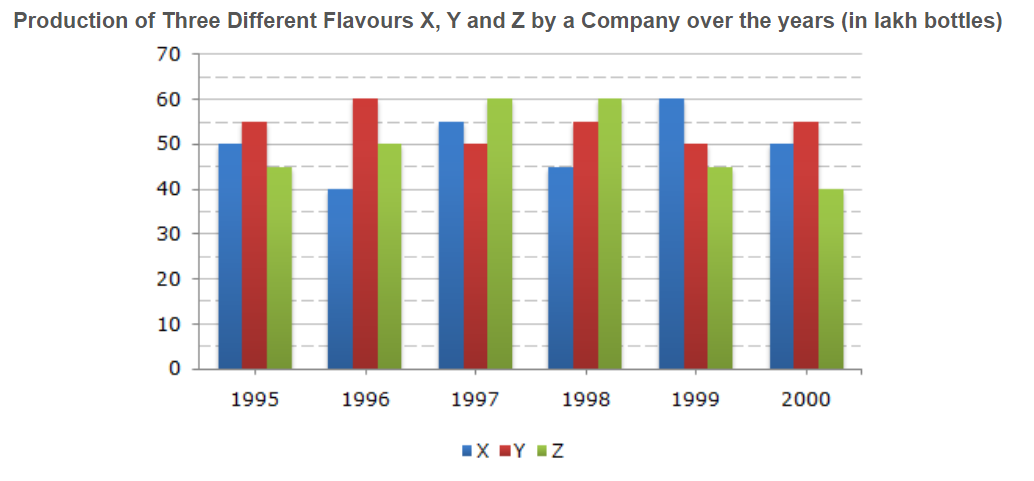
Question 17. A soft drink company prepares drinks of three different flavours - X, Y and Z. The production of three flavours over a period of six years has been expressed in the bar graph provided below.
For which of the following years the percentage of rise/fall in production from the previous year is the maximum for the flavour Y?A Soft Drink Company Prepares Drinks Of Three Different Flav...
  1.    1996
  2.    1997
  3.    1998
  4.    1999
 Discuss Question
Answer: Option B. -> 1997
Answer: (b).1997
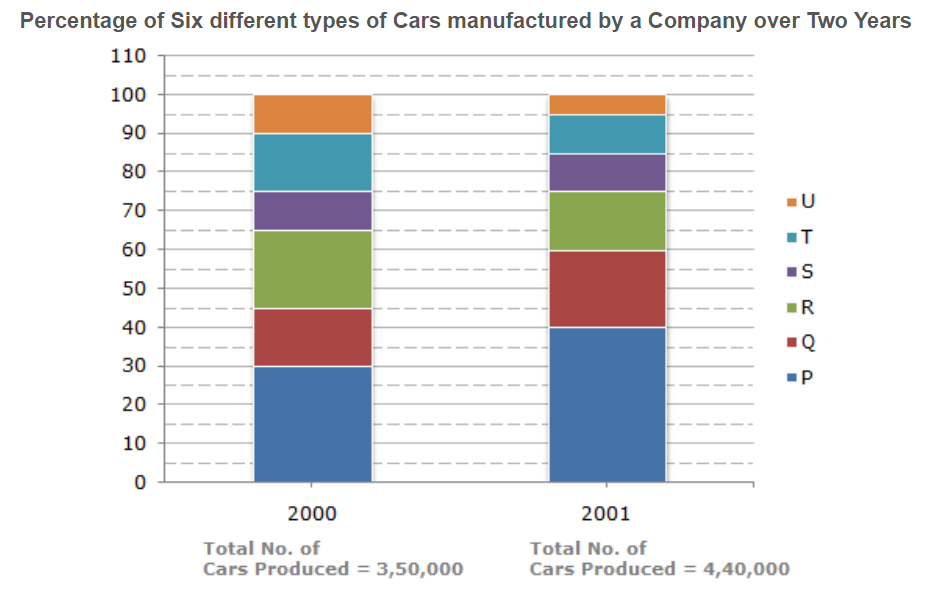
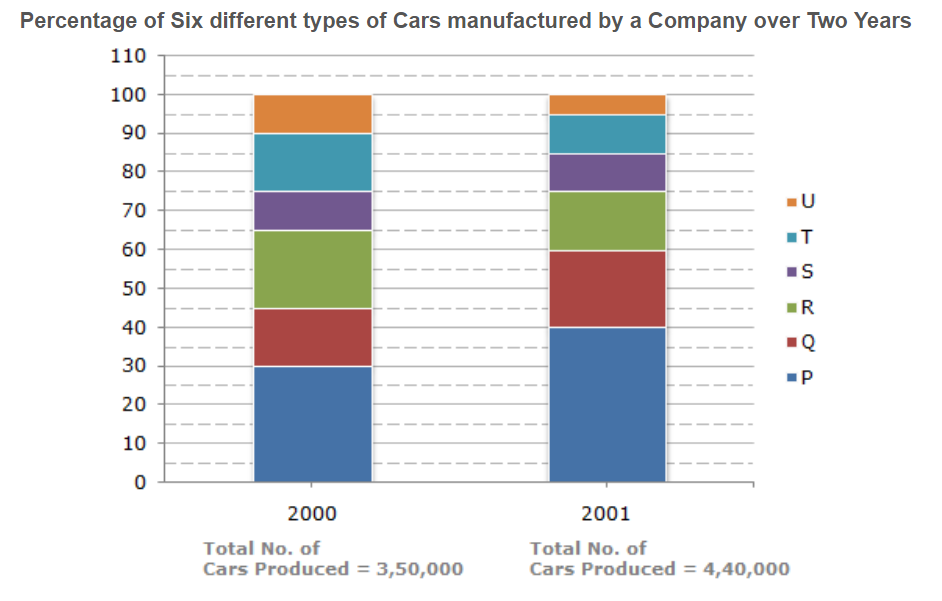
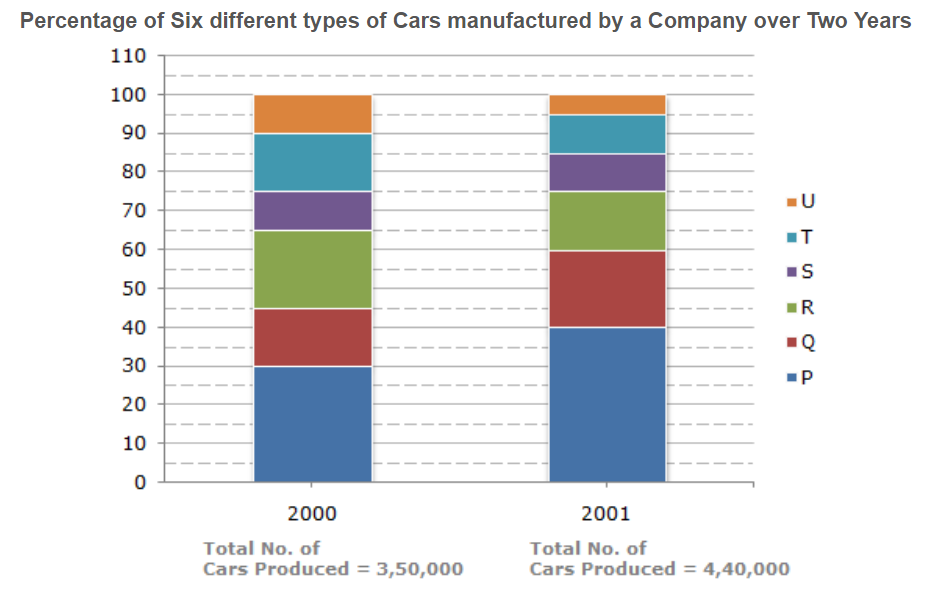
Question 18. The bar graph given below shows the percentage distribution of the total production of a car manufacturing company into various models over two years.
What was the difference in the number of Q type cars produced in 2000 and that produced in 2001?The Bar Graph Given Below Shows The Percentage Distribution ...
  1.    35,500
  2.    27,000
  3.    22,500
  4.    17,500
 Discuss Question
Answer: Option A. -> 35,500
Answer: (a).35,500
Question 19. The bar graph given below shows the percentage distribution of the total production of a car manufacturing company into various models over two years.
Total number of cars of models P, Q and T manufactured in 2000 is?The Bar Graph Given Below Shows The Percentage Distribution ...
  1.    2,45,000
  2.    2,27,500
  3.    2,10,000
  4.    1,92,500
 Discuss Question
Answer: Option C. -> 2,10,000
Answer: (c).2,10,000
Question 20. The bar graph given below shows the percentage distribution of the total production of a car manufacturing company into various models over two years.
If 85% of the S type cars produced in each year were sold by the company, how many S type cars remain unsold?The Bar Graph Given Below Shows The Percentage Distribution ...
  1.    7650
  2.    9350
  3.    11,850
  4.    12,250
 Discuss Question
Answer: Option C. -> 11,850
Answer: (c).11,850

Latest Videos

Latest Test Papers