Reasoning Aptitude > Data Interpretation
BAR GRAPH MCQs
Bar Charts
Total Questions : 165
| Page 1 of 17 pages
Answer: Option C. -> Hyundai
Answer: (c).Hyundai
Answer: (c).Hyundai
Answer: Option D. -> 962.76
Answer: (d).962.76
Answer: (d).962.76
Answer: Option C. -> Three
Answer: (c).Three
Answer: (c).Three
Answer: Option B. -> 1.5
Answer: (b).1.5
Answer: (b).1.5
Answer: Option B. -> 142.48
Answer: (b).142.48
Answer: (b).142.48
Answer: Option C. -> Three
Answer: (c).Three
Answer: (c).Three
Question 7. The total of the first three deficit countries (in Rs. crores) = 3594.3. The total of next five deficit countries (in Rs. crores) = 2588.5. The total of the last five deficit countries (in Rs. crores) = 334.2.
The ratio between the difference between the highest and the lowest of the surplus countries to the difference between Bangladesh and Oman is ?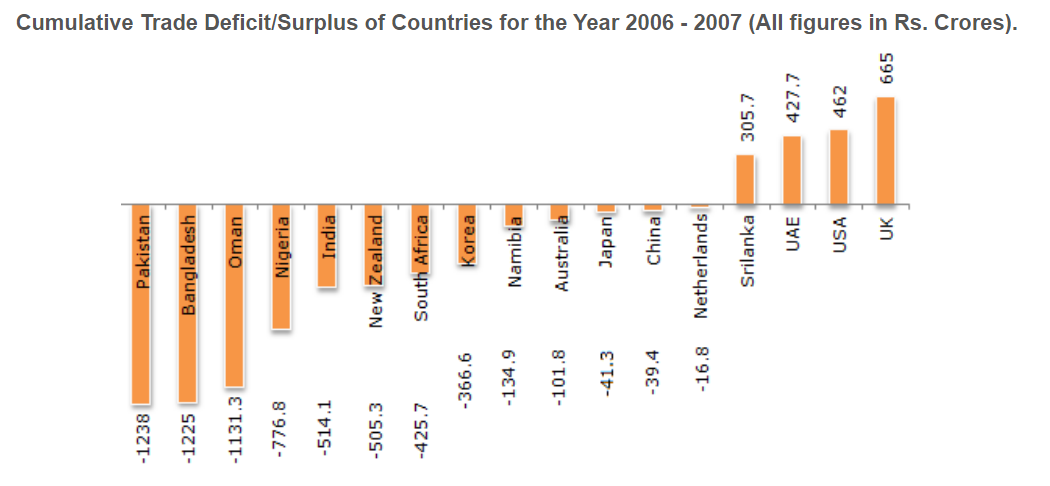
The ratio between the difference between the highest and the lowest of the surplus countries to the difference between Bangladesh and Oman is ?

Answer: Option D. -> 3.83
Answer: (d).3.83
Answer: (d).3.83
Question 8. The total of the first three deficit countries (in Rs. crores) = 3594.3. The total of next five deficit countries (in Rs. crores) = 2588.5. The total of the last five deficit countries (in Rs. crores) = 334.2.
The state whose surplus is nearly equal to the average of the four surplus countries is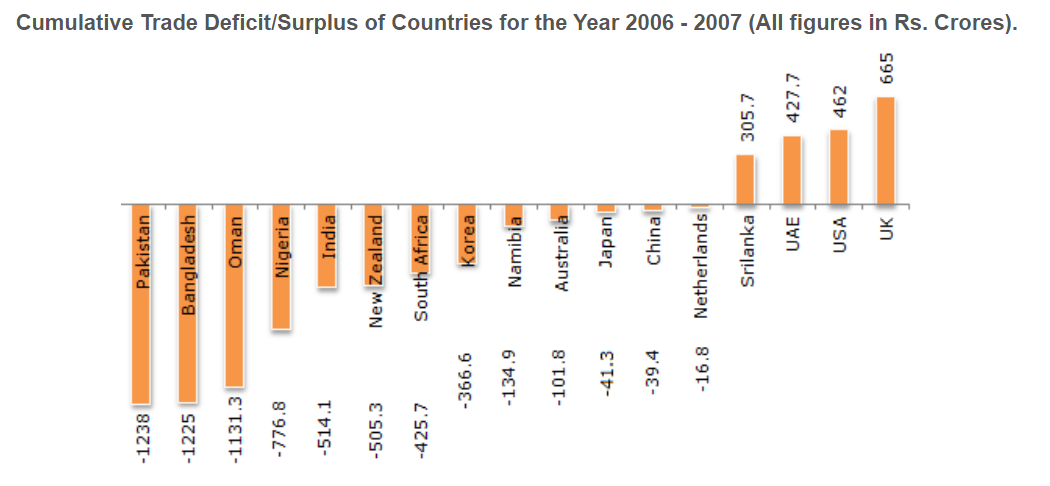
The state whose surplus is nearly equal to the average of the four surplus countries is

Answer: Option C. -> USA
Answer: (c).USA
Answer: (c).USA
Question 9. The total of the first three deficit countries (in Rs. crores) = 3594.3. The total of next five deficit countries (in Rs. crores) = 2588.5. The total of the last five deficit countries (in Rs. crores) = 334.2.
The ratio of the deficit of the first five deficit countries to the overall deficit of all the deficit countries is nearly equal to ?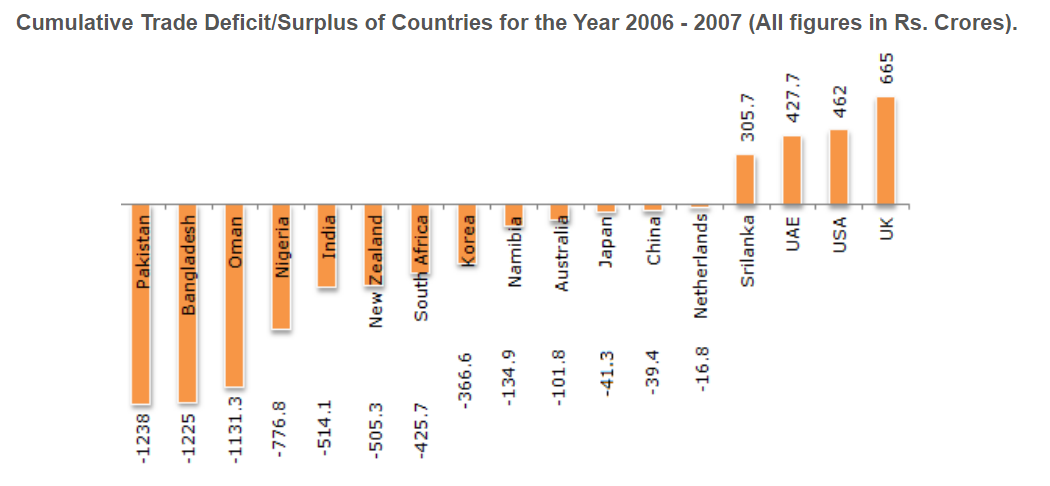
The ratio of the deficit of the first five deficit countries to the overall deficit of all the deficit countries is nearly equal to ?

Answer: Option B. -> 0.75
Answer: (b).0.75
Answer: (b).0.75
Question 10. The total of the first three deficit countries (in Rs. crores) = 3594.3. The total of next five deficit countries (in Rs. crores) = 2588.5. The total of the last five deficit countries (in Rs. crores) = 334.2.
The average of the total deficit of the middle five deficit is closest to the deficit of which country ?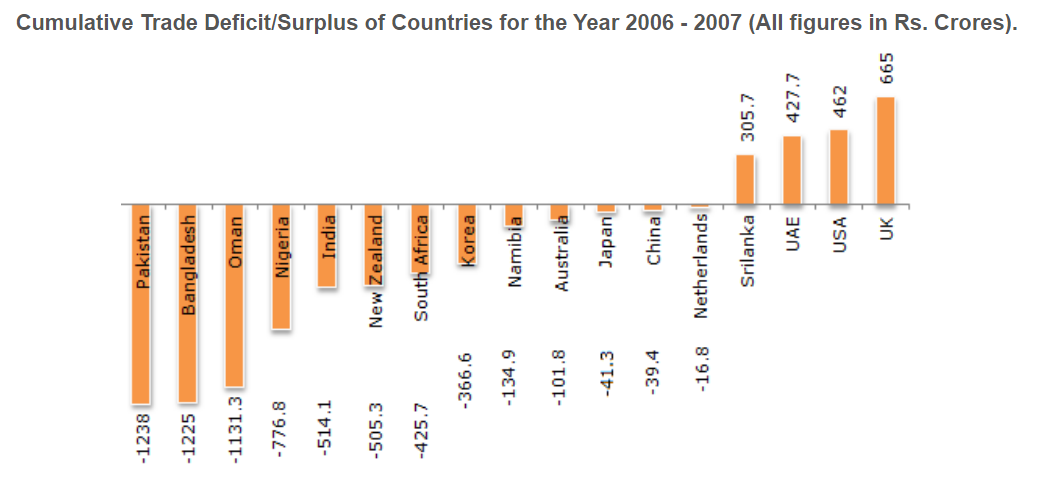
The average of the total deficit of the middle five deficit is closest to the deficit of which country ?

Answer: Option A. -> Korea
Answer: (a).Korea
Answer: (a).Korea

