Reasoning Aptitude > Data Interpretation
BAR GRAPH MCQs
Bar Charts
Total Questions : 165
| Page 5 of 17 pages
Question 41. The following chart represents the number of students who passed the CAT exam or the XAT exam or the CET exam or None of these exams. (Assume that there are no students who passed more than one exam.)
Which year showed the best result in MBA entrance exams (in terms of percentage of students who cleared) ?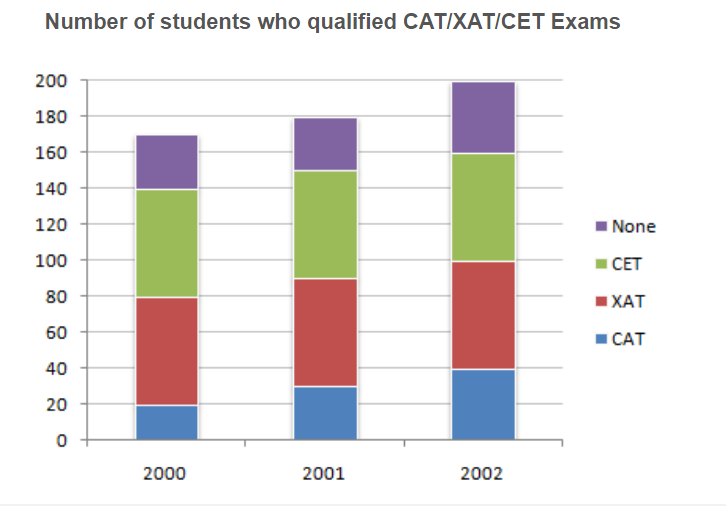
Which year showed the best result in MBA entrance exams (in terms of percentage of students who cleared) ?

Answer: Option B. -> 2001
Answer: (b).2001
Answer: (b).2001
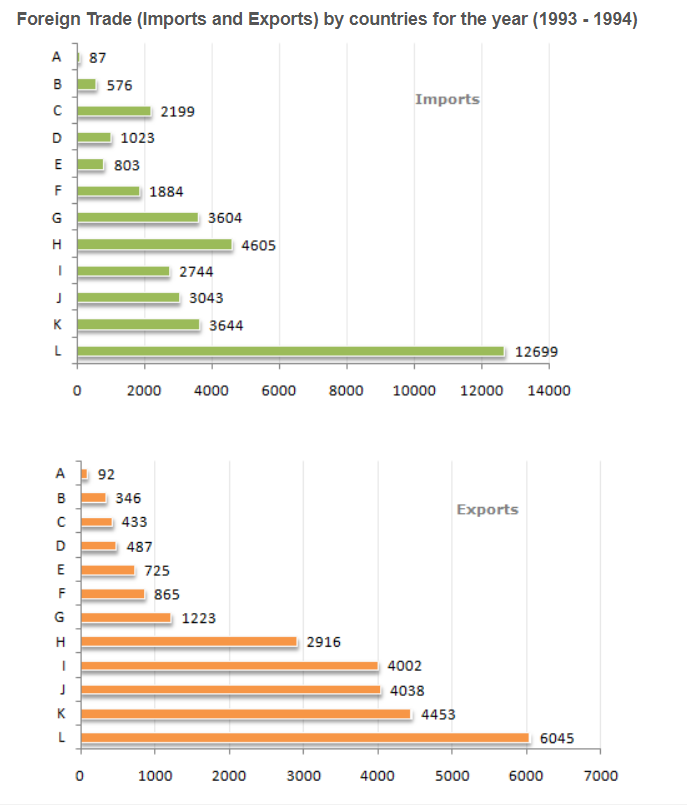
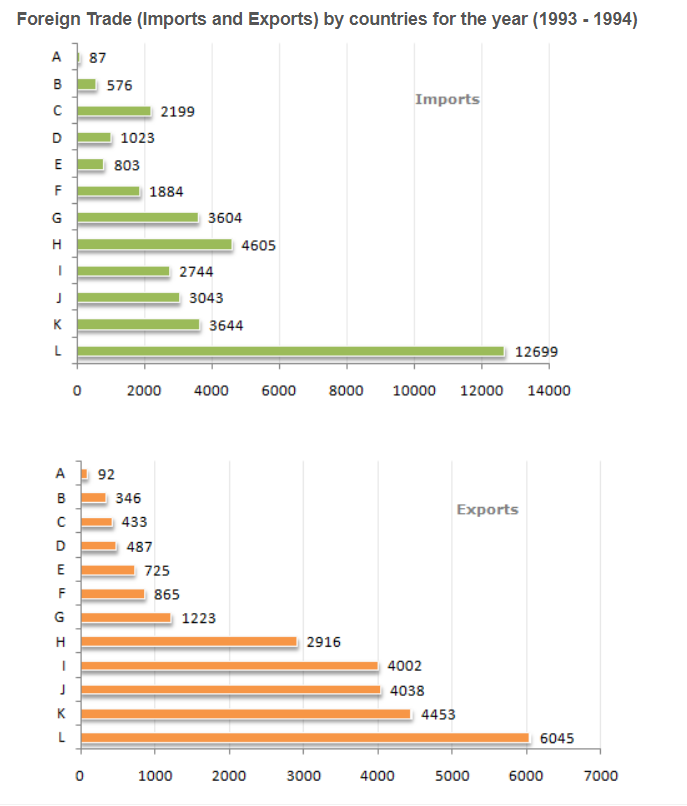
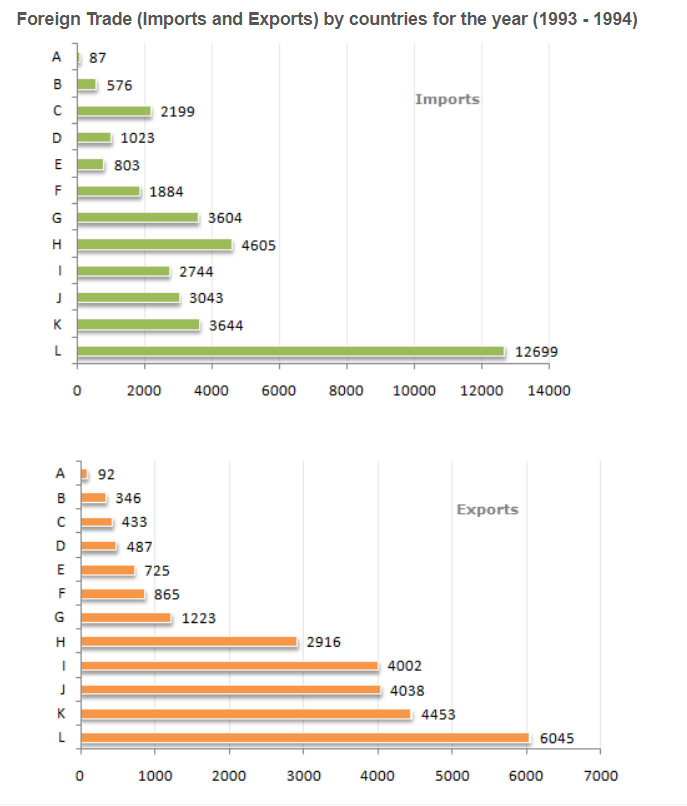
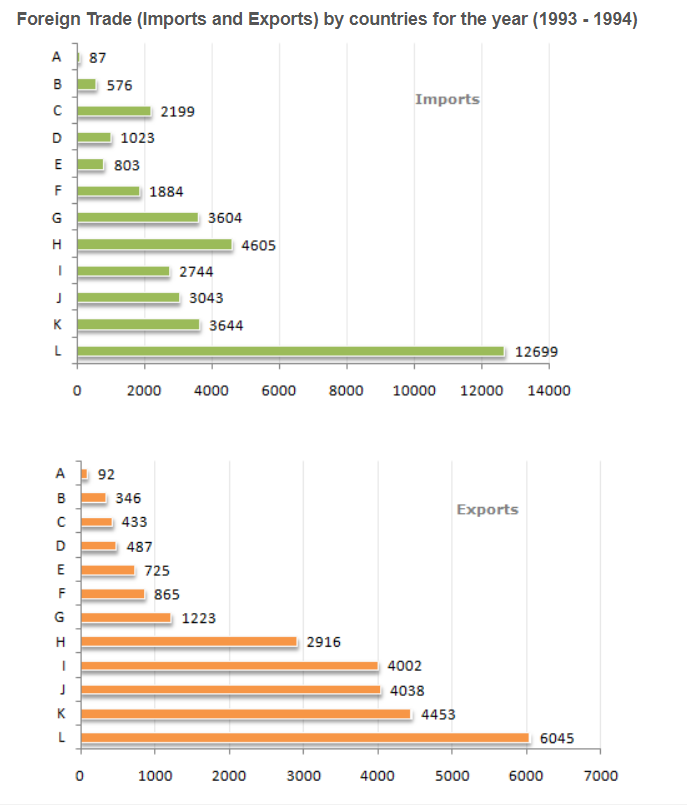
Answer: Option B. -> 4656.6 deficit
Answer: (b).4656.6 deficit
Answer: (b).4656.6 deficit
Answer: Option B. -> 69
Answer: (b).69
Answer: (b).69
Answer: Option B. -> 4
Answer: (b).4
Answer: (b).4
Answer: Option B. -> 11286 deficit
Answer: (b).11286 deficit
Answer: (b).11286 deficit
Answer: Option D. -> L
Answer: (d).L
Answer: (d).L
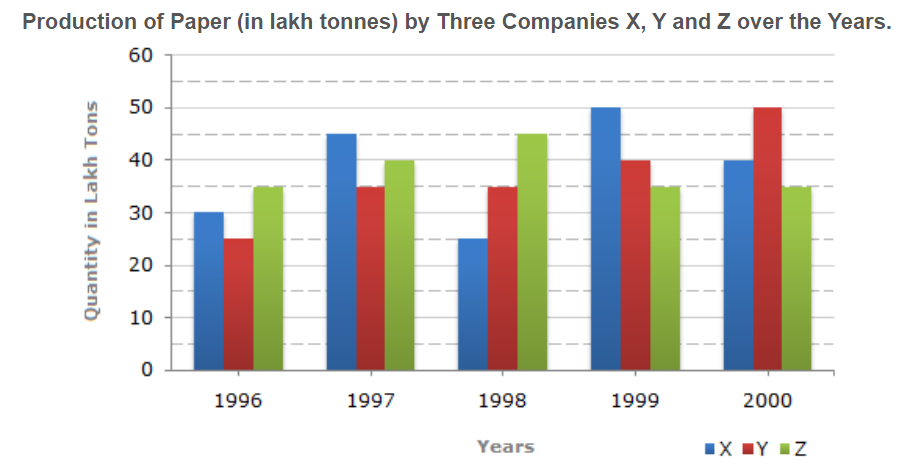
Answer: Option B. -> 20,00,000 tons
Answer: (b).20,00,000 tons
Answer: (b).20,00,000 tons
Question 48. Out of the two bar graphs provided below, one shows the amounts (in Lakh Rs.) invested by a Company in purchasing raw materials over the years and the other shows the values (in Lakh Rs.) of finished goods sold by the Company over the years.
The maximum difference between the amount invested in Raw materials and value of sales of finished goods was during the year?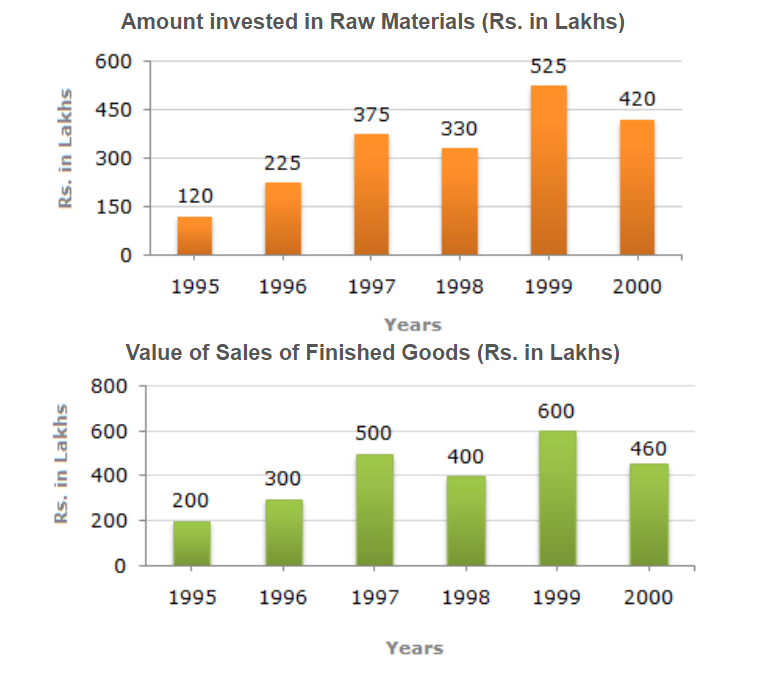
The maximum difference between the amount invested in Raw materials and value of sales of finished goods was during the year?

Answer: Option C. -> 1997
Answer: (c).1997
Answer: (c).1997
Question 49. Out of the two bar graphs provided below, one shows the amounts (in Lakh Rs.) invested by a Company in purchasing raw materials over the years and the other shows the values (in Lakh Rs.) of finished goods sold by the Company over the years.
In which year, the percentage change (compared to the previous year) in the investment on Raw materials is same as that in the value of sales of finished goods?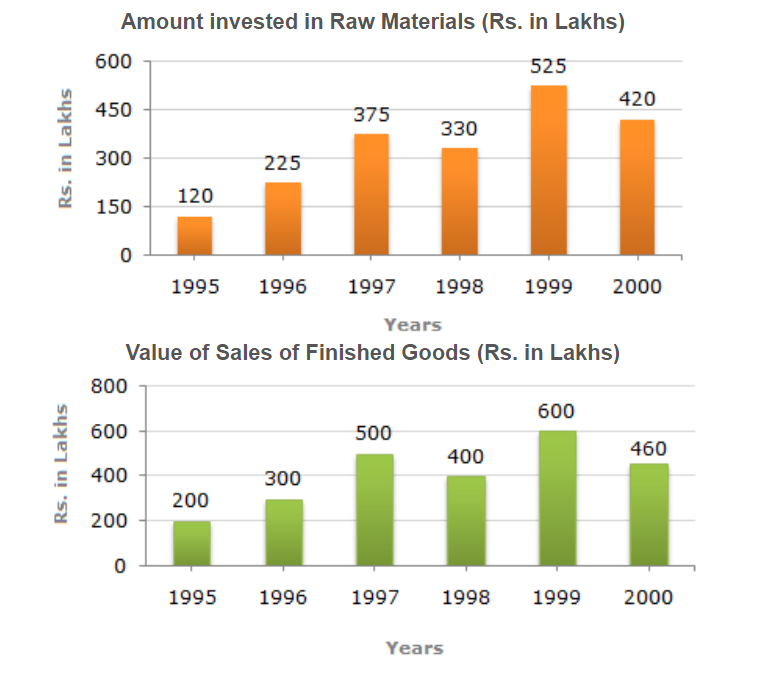
In which year, the percentage change (compared to the previous year) in the investment on Raw materials is same as that in the value of sales of finished goods?

Answer: Option B. -> 1997
Answer: (b).1997
Answer: (b).1997
Question 50. Out of the two bar graphs provided below, one shows the amounts (in Lakh Rs.) invested by a Company in purchasing raw materials over the years and the other shows the values (in Lakh Rs.) of finished goods sold by the Company over the years.
What was the difference between the average amount invested in Raw materials during the given period and the average value of sales of finished goods during this period?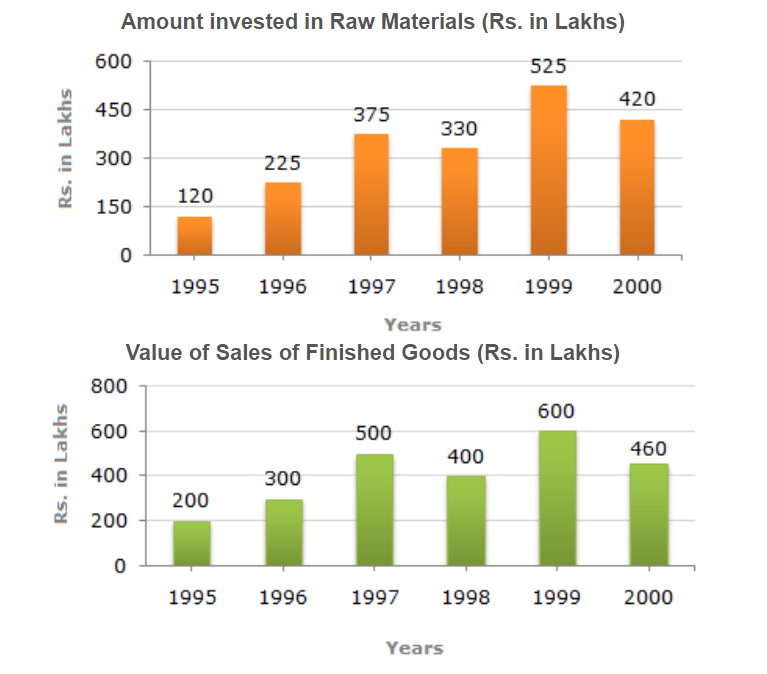
What was the difference between the average amount invested in Raw materials during the given period and the average value of sales of finished goods during this period?

Answer: Option D. -> Rs. 77.5 lakhs
Answer: (d).Rs. 77.5 lakhs
Answer: (d).Rs. 77.5 lakhs

