Question
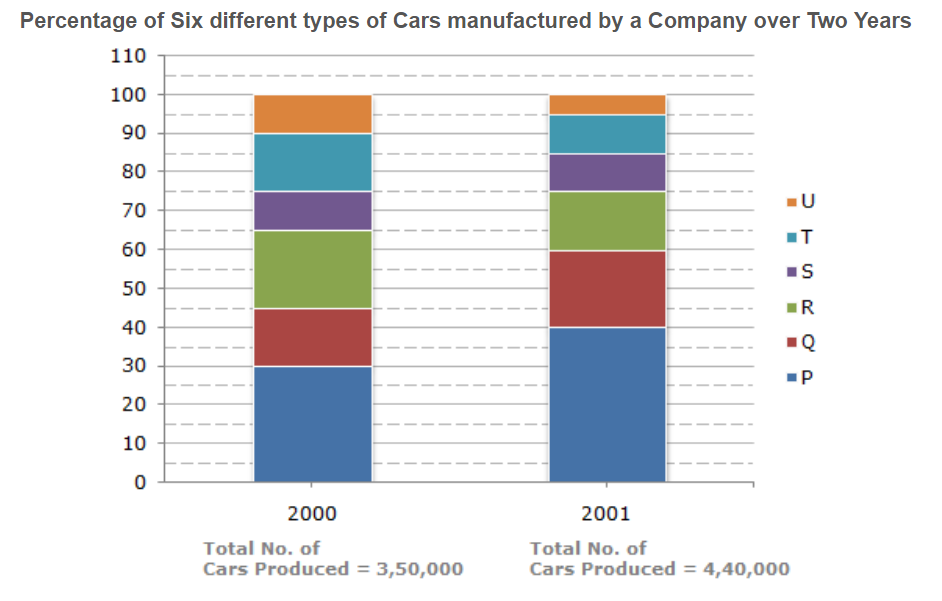
The bar graph given below shows the percentage distribution of the total production of a car manufacturing company into various models over two years.
For which model the percentage rise/fall in production from 2000 to 2001 was minimum?
For which model the percentage rise/fall in production from 2000 to 2001 was minimum?

Answer: Option B
Answer: (b).R
Was this answer helpful ?
Answer: (b).R
Was this answer helpful ?


Submit Solution