Sail E0 Webinar

Reasoning Aptitude > Data Interpretation

BAR GRAPH MCQs

Bar Charts

Total Questions : 165 | Page 7 of 17 pages
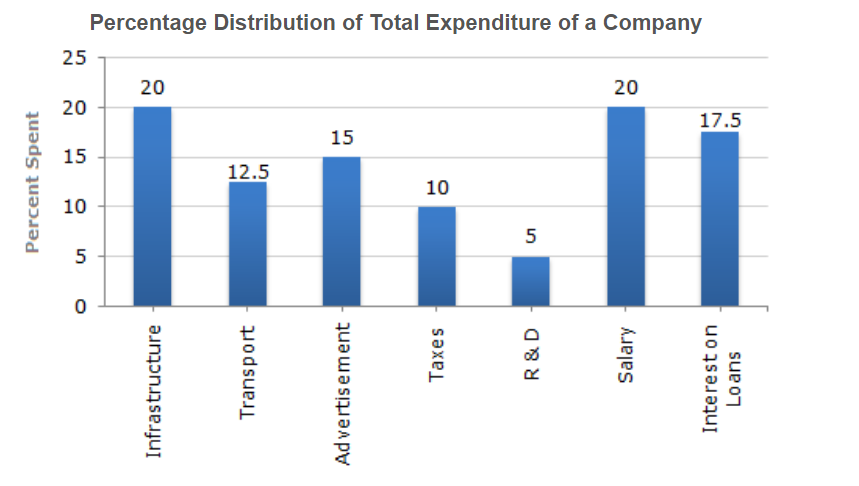
Question 61. The bar graph given below shows the percentage distribution of the total expenditures of a company under various expense heads during 2003.
What is the ratio of the total expenditure on infrastructure and transport to the total expenditure on taxes and interest on loans?The Bar Graph Given Below Shows The Percentage Distribution ...
  1.    5:4
  2.    8:7
  3.    9:7
  4.    13:11
 Discuss Question
Answer: Option D. -> 13:11
Answer: (d).13:11
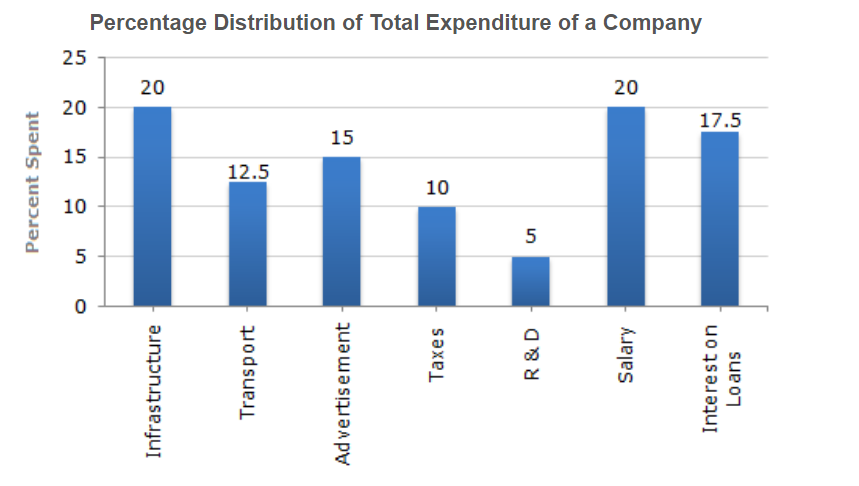
Question 62. The bar graph given below shows the percentage distribution of the total expenditures of a company under various expense heads during 2003.
The expenditure on the interest on loans is by what percent more than the expenditure on transport?The Bar Graph Given Below Shows The Percentage Distribution ...
  1.    5%
  2.    10%
  3.    20%
  4.    40%
 Discuss Question
Answer: Option D. -> 40%
Answer: (d).40%
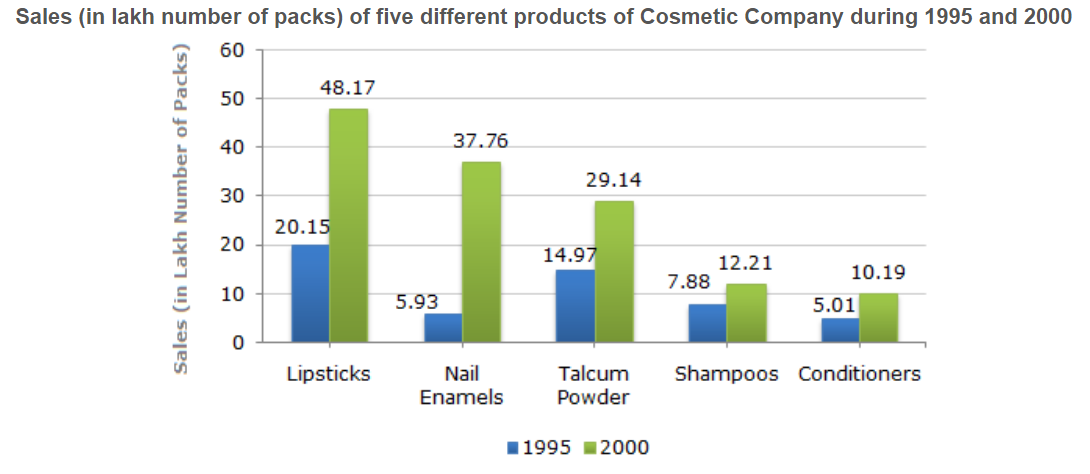
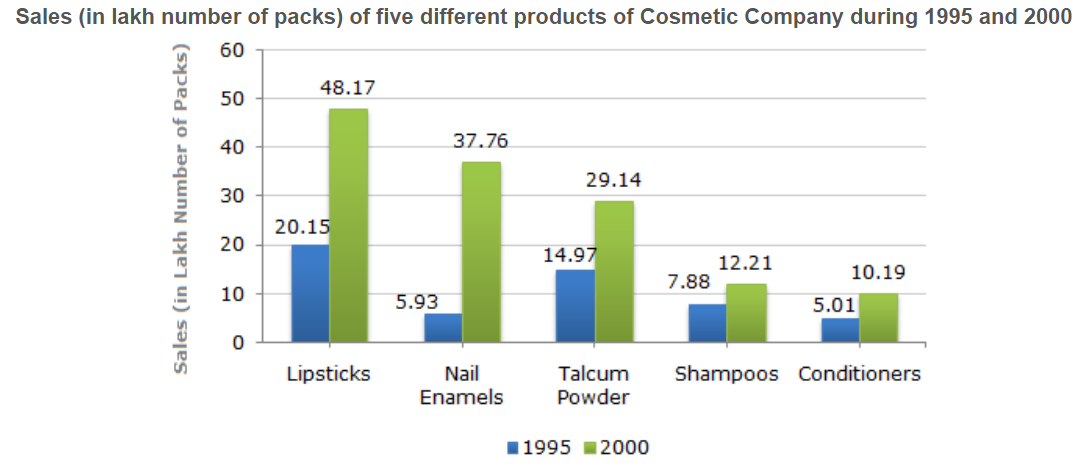
Question 63. A cosmetic company provides five different products. The sales of these five products (in lakh number of packs) during 1995 and 2000 are shown in the following bar graph.
During the period 1995-2000, the minimum rate of increase in sales is in the case of?A Cosmetic Company Provides Five Different Products. The Sal...
  1.    Shampoos
  2.    Nail enamels
  3.    Talcum powders
  4.    Lipsticks
 Discuss Question
Answer: Option A. -> Shampoos
Answer: (a).Shampoos
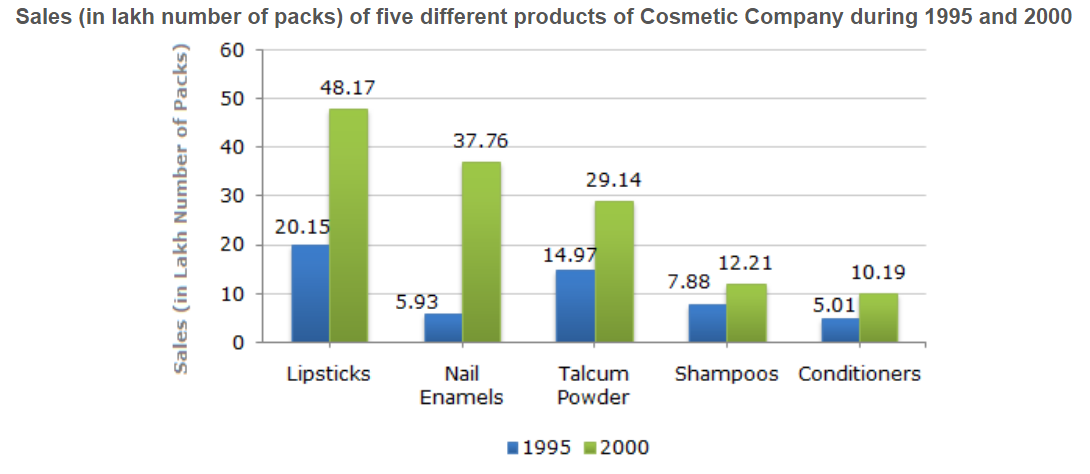
Question 64. A cosmetic company provides five different products. The sales of these five products (in lakh number of packs) during 1995 and 2000 are shown in the following bar graph.
The sales of lipsticks in 2000 was by what percent more than the sales of nail enamels in 2000? (rounded off to nearest integer)A Cosmetic Company Provides Five Different Products. The Sal...
  1.    33%
  2.    31%
  3.    28%
  4.    22%
 Discuss Question
Answer: Option C. -> 28%
Answer: (c).28%
Question 65. A cosmetic company provides five different products. The sales of these five products (in lakh number of packs) during 1995 and 2000 are shown in the following bar graph.
What is the approximate ratio of the sales of nail enamels in 2000 to the sales of Talcum powders in 1995?A Cosmetic Company Provides Five Different Products. The Sal...
  1.    7:2
  2.    5:2
  3.    4:3
  4.    2:1
 Discuss Question
Answer: Option B. -> 5:2
Answer: (b).5:2
Question 66. A cosmetic company provides five different products. The sales of these five products (in lakh number of packs) during 1995 and 2000 are shown in the following bar graph.
The sales have increase by nearly 55% from 1995 to 2000 in the case of?A Cosmetic Company Provides Five Different Products. The Sal...
  1.    Lipsticks
  2.    Nail enamels
  3.    Talcum powders
  4.    Shampoos
 Discuss Question
Answer: Option D. -> Shampoos
Answer: (d).Shampoos
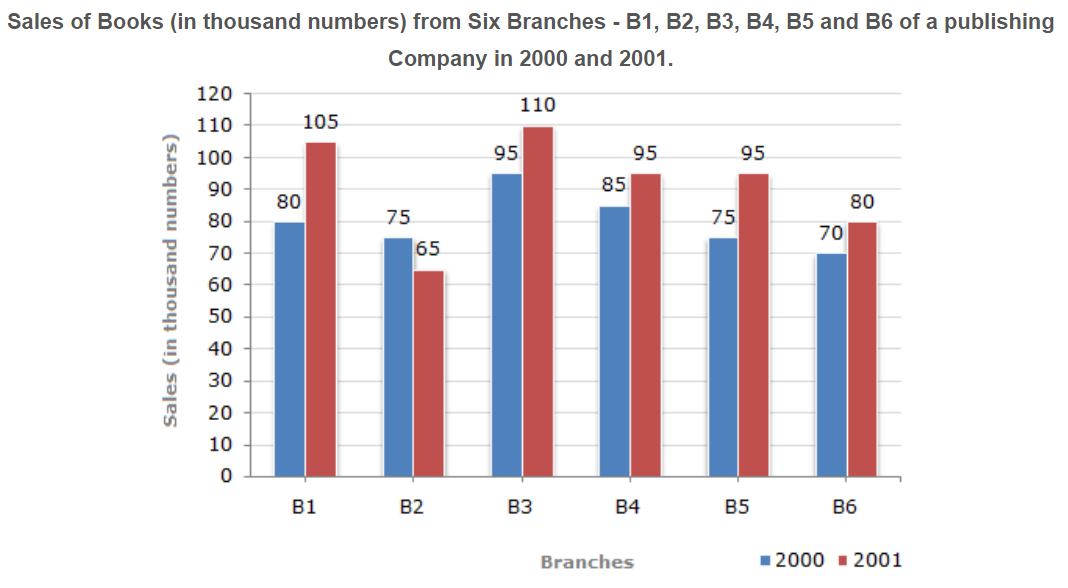
Question 67. The bar graph given below shows the sales of books (in thousand number) from six branches of a publishing company during two consecutive years 2000 and 2001.
What is the ratio of the total sales of branch B2 for both years to the total sales of branch B4 for both years?The Bar Graph Given Below Shows The Sales Of Books (in Thous...
  1.    2:3
  2.    3:5
  3.    4:5
  4.    7:9
 Discuss Question
Answer: Option D. -> 7:9
Answer: (d).7:9
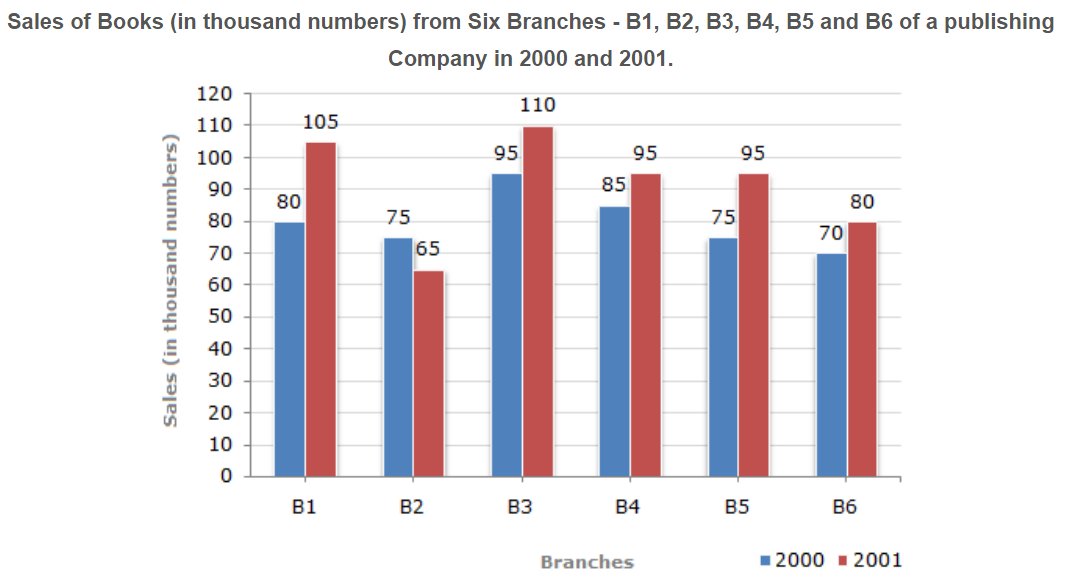
Question 68. The bar graph given below shows the sales of books (in thousand number) from six branches of a publishing company during two consecutive years 2000 and 2001.
Total sales of branch B6 for both the years is what percent of the total sales of branches B3 for both the years?The Bar Graph Given Below Shows The Sales Of Books (in Thous...
  1.    68.54%
  2.    71.11%
  3.    73.17%
  4.    75.55%
 Discuss Question
Answer: Option C. -> 73.17%
Answer: (c).73.17%
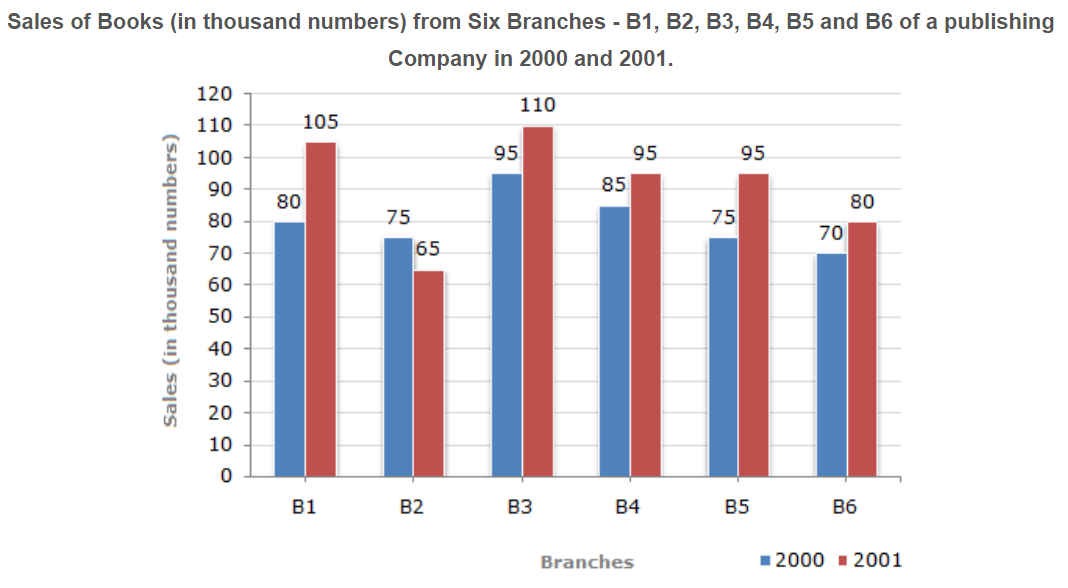
Question 69. The bar graph given below shows the sales of books (in thousand number) from six branches of a publishing company during two consecutive years 2000 and 2001.
What percent of the average sales of branches B1, B2 and B3 in 2001 is the average sales of branches B1, B3 and B6 in 2000?The Bar Graph Given Below Shows The Sales Of Books (in Thous...
  1.    75%
  2.    77.5%
  3.    82.5%
  4.    87.5%
 Discuss Question
Answer: Option D. -> 87.5%
Answer: (d).87.5%
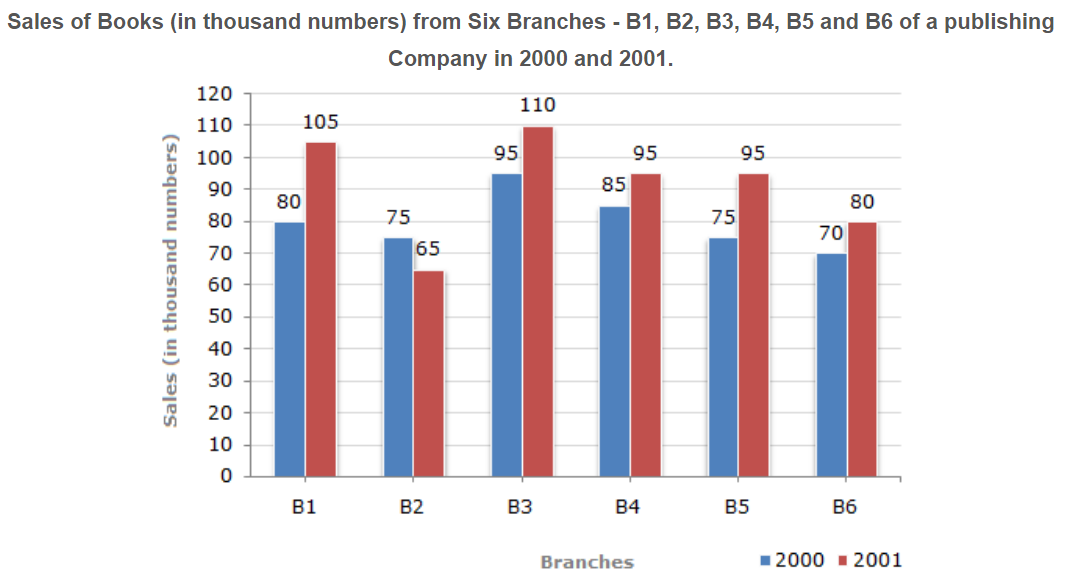
Question 70. The bar graph given below shows the sales of books (in thousand number) from six branches of a publishing company during two consecutive years 2000 and 2001.
Total sales of branches B1, B3 and B5 together for both the years (in thousand numbers) is?The Bar Graph Given Below Shows The Sales Of Books (in Thous...
  1.    250
  2.    310
  3.    435
  4.    560
 Discuss Question
Answer: Option D. -> 560
Answer: (d).560

Latest Videos

Latest Test Papers