Reasoning Aptitude > Data Interpretation
BAR GRAPH MCQs
Bar Charts
Total Questions : 165
| Page 17 of 17 pages
Answer: Option C. -> 20%
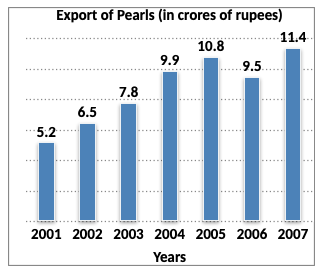
Percentage increase in export from 2006 to 2007.
$$\eqalign{
& = \left(\frac{11.4-9.5}{9.5}\times100\right)\% \cr
& = \left(\frac{1.9}{9.5}\times100\right)\% \cr
& = \left(\frac{19}{95}\times100\right)\% \cr
& = 20\% \cr} $$
Percentage increase in export from 2006 to 2007.
$$\eqalign{
& = \left(\frac{11.4-9.5}{9.5}\times100\right)\% \cr
& = \left(\frac{1.9}{9.5}\times100\right)\% \cr
& = \left(\frac{19}{95}\times100\right)\% \cr
& = 20\% \cr} $$
Answer: Option B. -> 4 years
Average export during the given period = Rs. 8.73 crores.
If was above average in 2004, 2005, 2006 and 2007.
i.e. in 4 years
Average export during the given period = Rs. 8.73 crores.
If was above average in 2004, 2005, 2006 and 2007.
i.e. in 4 years
Answer: Option D. -> 2004
$$\eqalign{
& \text{Increase % in various years} \cr
& 2002 → \left\{\frac{\left(6.5-5.2\right)}{5.2}\times100\right\}\% \cr
& \,\,\,\,\,\,\,\,\,\,\,\,\, = \left(\frac{1.3}{5.2}\times100\right)\% \cr
& \,\,\,\,\,\,\,\,\,\,\,\,\, = \left(\frac{13}{52}\times100\right)\% \cr
& \,\,\,\,\,\,\,\,\,\,\,\,\, = 25\% \cr
\cr
& 2003 → \left\{\frac{\left(7.8-6.5\right)}{6.5}\times100\right\}\% \cr
& \,\,\,\,\,\,\,\,\,\,\,\,\, = \left(\frac{1.3}{6.5}\times100\right)\% \cr
& \,\,\,\,\,\,\,\,\,\,\,\,\, = \left(\frac{13}{65}\times100\right)\% \cr
& \,\,\,\,\,\,\,\,\,\,\,\,\, = 20\% \cr
\cr
& 2004 → \left\{\frac{\left(9.9-7.8\right)}{7.8}\times100\right\}\% \cr
& \,\,\,\,\,\,\,\,\,\,\,\,\, = \left(\frac{2.1}{7.8}\times100\right)\% \cr
& \,\,\,\,\,\,\,\,\,\,\,\,\, = \left(\frac{21}{78}\times100\right)\% \cr
& \,\,\,\,\,\,\,\,\,\,\,\,\, = 26.9\% \cr
\cr
& 2005 → \left\{\frac{\left(10.8-9.9\right)}{9.9}\times100\right\}\% \cr
& \,\,\,\,\,\,\,\,\,\,\,\,\, = \left(\frac{0.9}{9.9}\times100\right)\% \cr
& \,\,\,\,\,\,\,\,\,\,\,\,\, = \left(\frac{9}{99}\times100\right)\% \cr
& \,\,\,\,\,\,\,\,\,\,\,\,\, = \frac{100}{11}\% \cr
& \,\,\,\,\,\,\,\,\,\,\,\,\, = 9.090\% \cr
\cr
& 2007 → \left\{\frac{\left(11.4-9.5\right)}{9.5}\times100\right\}\% \cr
& \,\,\,\,\,\,\,\,\,\,\,\,\, = \left(\frac{1.9}{9.5}\times100\right)\% \cr
& \,\,\,\,\,\,\,\,\,\,\,\,\, = \left(\frac{19}{95}\times100\right)\% \cr
& \,\,\,\,\,\,\,\,\,\,\,\,\, = 20\% \cr
& \cr } $$
Clearly, the maximum increase was in 2004
Answer: Option B. -> 8.73 crores
Average export of pearls over the period
$$ = \left\{\frac{1}{7}\left(5.2+6.5+7.8+9.9+10.8+9.5+11.4\right)\right\}\text{crores}$$
$$\eqalign{
& = \frac{61.1}{7}\text{ crores} \cr
& = 8.728 \text{ crores} \cr
& = \text{Rs. }8.73 \text{ crores} \cr} $$
Average export of pearls over the period
$$ = \left\{\frac{1}{7}\left(5.2+6.5+7.8+9.9+10.8+9.5+11.4\right)\right\}\text{crores}$$
$$\eqalign{
& = \frac{61.1}{7}\text{ crores} \cr
& = 8.728 \text{ crores} \cr
& = \text{Rs. }8.73 \text{ crores} \cr} $$
Answer: Option B. -> 2003 and 2004
$$\eqalign{
& \text{Average export in 2003 and 2004} \cr
& = \frac{7.8+9.9}{2} \text{ crores} \cr
& = \frac{17.7}{2} \text{ crores} \cr
& = \text{Rs. }8.85 \text{ crores} \cr
& \approx \text{Rs. }9 \text{ crores} \cr} $$
$$\eqalign{
& \text{Average export in 2003 and 2004} \cr
& = \frac{7.8+9.9}{2} \text{ crores} \cr
& = \frac{17.7}{2} \text{ crores} \cr
& = \text{Rs. }8.85 \text{ crores} \cr
& \approx \text{Rs. }9 \text{ crores} \cr} $$


