Question
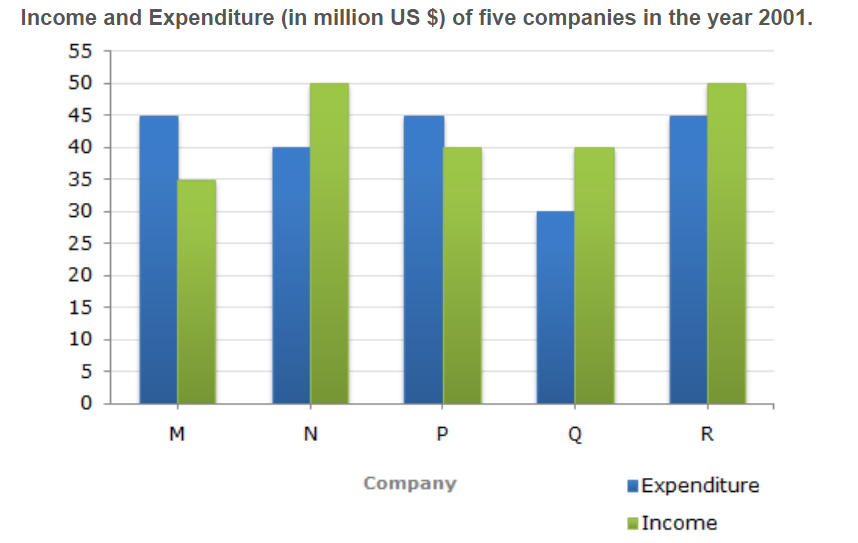
The following bar graph shows the Income and Expenditures (in million US $) of five companies in the year 2001. The percent profit or loss of a company is given by
% Profit/Loss =(Income - Expenditure)/Expenditurex 100
If the income of Company Q in 2001 was 10% more than its income in 2000 and the Company had earned a profit of 20% in 2000, then its expenditure in 2000 (in million US $) was?
% Profit/Loss =(Income - Expenditure)/Expenditurex 100
If the income of Company Q in 2001 was 10% more than its income in 2000 and the Company had earned a profit of 20% in 2000, then its expenditure in 2000 (in million US $) was?

Answer: Option B
Answer: (b).30.30
Was this answer helpful ?
Answer: (b).30.30
Was this answer helpful ?


Submit Solution