6th Grade > Mathematics
DATA HANDLING MCQs
:
Each part: 1 Mark
The various inferences that we can draw from the above bar graph are:
In 1989 100 books were sold.
In 1990 200 books were sold.
In 1991 600 booksweresold.
In 1992 300 booksweresold.
In 1993 400 bookswere sold.
a) As we can see from the above bar graph, 200 books were sold in 1990.
b) In 1989, 100 books were sold.
c) Number of books sold in 1993 = 400
Number of books sold in 1992 = 300
∴ The difference in the number of books sold in 1993 and 1992 = 400 - 300 = 100.
:
Each part: 1 Mark
a) The bar graph shows the total rainfall (in mm) in a city in different years. [ From 2007 to 2012]
b) Just by inspection, we can findthat rainfall was maximum in the year 2012. The bar corresponding to the year 2012 is having maximum height.
c) Minimum rainfall wasin the year 2011.The bar corresponding to the year 2011is having minimumheight.
d) 550 mm of rainfall was recorded in the year 2007.
:
Let us arrange the following data in ascending order.
2,3,3,4,6,7,7,8,9,10.
We can clearly see from the above data that five students have marks greater than 6.
The bar graph shows the favourite subjects of 20 students in class VI 'B'. How many more of them prefer Mathematics to Science?
FAVOURITE SUBJECTS OF 20 STUDENTS
Here the horizontal axis is x axis which represents subjects and vertical axis is y axis which represents number of students. x axis represents subjects and the scale y axis 1 cm = 1 student.
:
C
5 of them prefer mathematics and only one prefer science.
So, 5 - 1 = 4
Therefore mathematics is preferred by 4 more students than science.
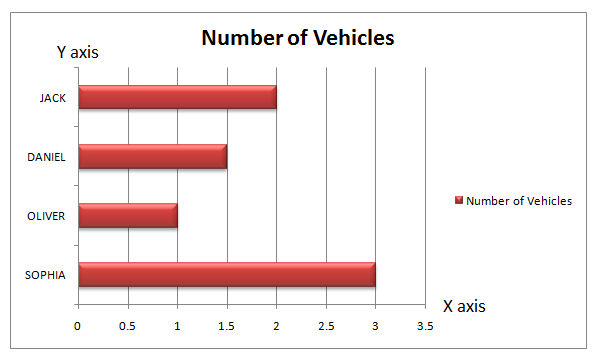
Look at the graph shown, thickness of bars and gap between bars are identical, it shows details of vehicles purchased by members of the residences of same apartment during the year.
1 unit of length represents 2 vehicles purchased.
Number of Vehicles Purchased during the Year
Who has purchased the maximum number of vehicles during the year?
Here the horizontal axis is x axis which represents number of vehicles and vertical axis is y axis which represents name of people. The scale for y axis is 1 cm = 1 name and x axis 2 cm = 1 vehicle .
:
A
By looking into the graph you can answer that Sophia has maximum number of cars during that year. Length of bar with respect to Sophia's shows largest, thus she has more number of vehicles than other members in the apartment.
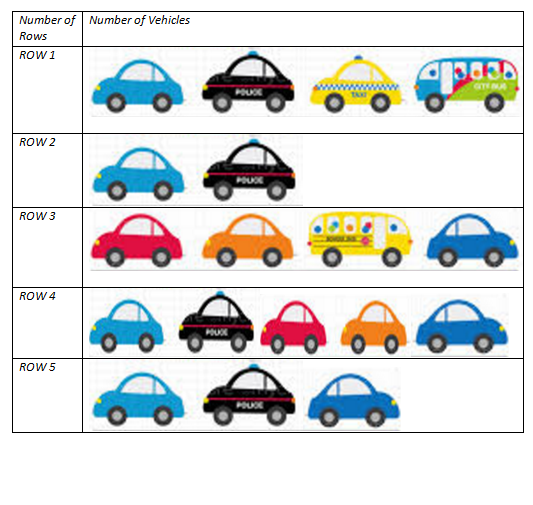
Look at the table, it shows details of types of vehicles present in the basement of an apartment. Each picture of a vehicle represents 5 vehicles. It is clear from the picture that each basement has different rows. Following table provides the information:
According to the table shown, how many vehicles are parked in the basement of the apartment?
:
C
In the table shown, each vehicle image represents 5 vehicles.
Number of vehicles in Row 1 = 4 × 5 = 20 vehicles.
Number of vehicles in Row 2 = 5 × 2 = 10 vehicles.
Number of vehicles in Row 3 = 4 × 5 = 20 vehicles.
Number of vehicles in Row 4 = 5 ×5 = 25 vehicles.
Number of vehicles in Row 5 = 5 × 3 = 15 vehicles.
On adding all the vehicles in all the rows, we get
= 20 + 10 +20 + 25 + 15 = 90 Vehicles.
∴ 90 Vehicles are parked in the basement of the apartment.
:
A pictograph is a way of showing data using images. It is generally represented by showing images on vertical lines.
The marks obtained by Jessica are shown below. Jenny scored 15% more marks in English than Jessica. What was Jenny's score in English?
Here the horizontal axis is x axis which represents subjects and vertical axis is y axis which represents marks. x axis represents and the scale for y axis 1 cm = 10 marks.
:
D
From the graph we can see that Jessica's score for English is 60.
Jenny's score in English is 15% more than Jessica's.
⇒60+15% × 60=60+15100×60
=60+9=69
∴ Jenny's score in English =69
:
D
The length of bar shows the value of data being represented. As the bar corresponding to Shruti is the smallest (corresponding to 0 value), she scored the least.


