6th Grade > Mathematics
DATA HANDLING MCQs
The graph given below shows the sale of tee-shirts from Mon to Sat. [3 MARKS]
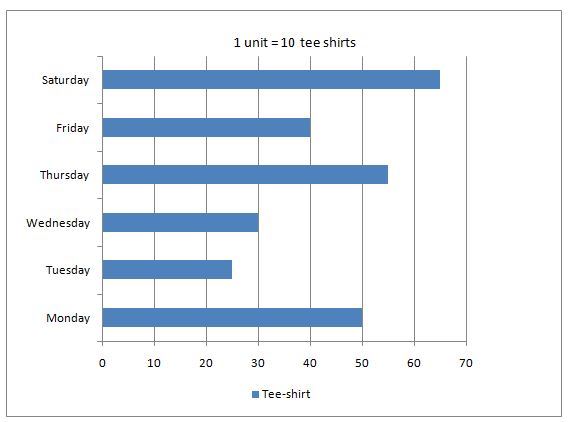
Answer the following questions from the bar graph:
a) What is the information given by the bar graph?
b) Which day have the maximum number of selling of tee shirts? How many tee shirts?
c) Give the number of tee shirts sold on Wednesday?
:
Each part: 1 Mark
a) The bar graph gives information of tee-shirts sold from Mon to Sat.
b) The maximum number of tee-shirts were sold on Saturday. That is 65.
c) The numbers of tee-shirts sold on Wednesday are 30.
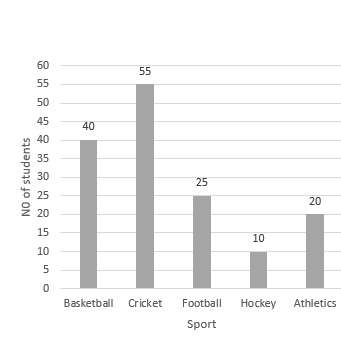
A survey was done to find in which game students are interested in their free time. Total numbers of students were 150.
Name of GameNumber of StudentsBasketball40Cricket55Football25Hockey10Athletics20
Draw a graph to show the given information. Take a scale: 1 unit length = 5 students.
a) Which game is preferred maximum by the students?
b) Which game is preferred maximum after basketball?
[4 MARKS]
:
Drawing: 2 Marks
Option a: 1 Mark
Option b: 1 Mark
Total number of pets class A has = 12 + 9 + 2 = 23
Total number of pets class B has = 14 + 8 + 3 = 25
Clearly, class B has the greater number of pets.
Class A has 2 birds, while class B has 3 birds.
So class B has the greater number of birds.
The following are the number of mattresses purchased for a lodging house during the first five months of a year. [4 MARKS]
MonthNumber of mattressesJanuary20February25March15April30May10
a. Draw the pictograph of above table.
b. In which month were the most number of mattresses sold?
c. In which month were the least number of mattresses sold?
:
Option a: 2 Marks
Option b: 1 Mark
Option c: 1 Mark
Suppose 1 block represent 5 mattresses
So for the month of January, we need 4 blocks.
For February, we need 5 blocks.
For March, we need 3 blocks.
For April, we need 6 blocks.
For May, we need 2 blocks.
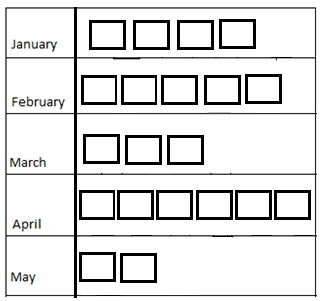
The maximum number of mattresses were sold in April = 30.
The minimum number of mattresses were sold in May = 10.
:
Concept: 1 Mark
Solution: 1 Mark
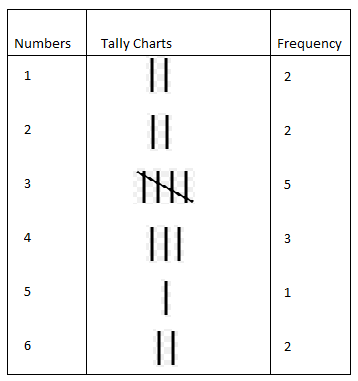
We can see from the above tally that every 5th mark is crossed.
∴ The count of straight lines = 5 + 2 = 7
The number of straight lines is 7.
:
Data is a collection of numbers gathered to give some information.
:
Least: 1 Mark
Maximum: 1 Mark
As we can see from the above pictograph, the least number of trees are cut on Saturday = 2.
The maximum number of trees are cut on Thursday = 8.
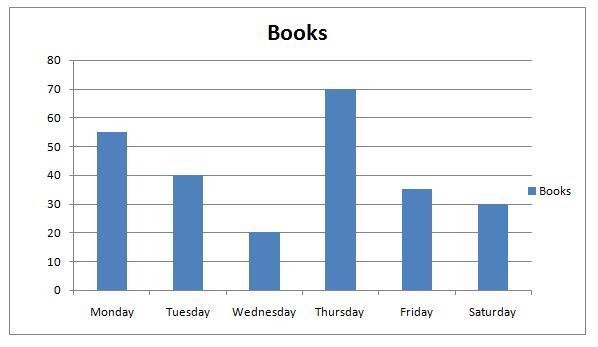
The given table shows the number of science books sold on 6 consecutive days.
DaysNumber of books soldMonday55Tuesday40Wednesday20Thursday70Friday35Saturday30
To represent the above information, draw a graph by choosing a scale according to you.
On which day, the maximum number of books were sold? [3 MARKS]
:
Each option: 1 Mark
a) Total numbers of cars sold in 2002-2003 =(6 + 12 + 5 + 16 + 7) × 1000 = 46000
b) Total sale of Maruti over three years = (5 + 8 +15) ×1000 = 28000
c) Total sale of GM over three years = (12 + 17 + 17) × 1000 = 46000
Hence, the difference between the sales of GM and Maruti = (46000 - 28000) =18000

