6th Grade > Mathematics
DATA HANDLING MCQs
Total Questions : 94
| Page 3 of 10 pages
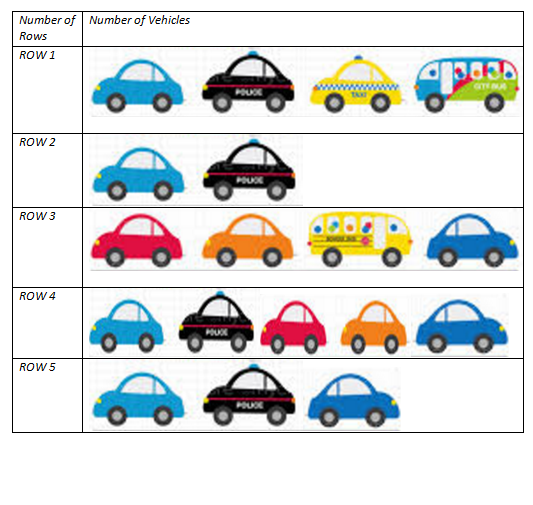
Question 21. Look at the table, it shows details of types of vehicles present in the basement of an apartment. Each picture of a vehicle represents 5 vehicles. It is clear from the picture that each basement has different rows. Following table provides the information:

According to the table shown, how many vehicles are parked in the basement of the apartment?

According to the table shown, how many vehicles are parked in the basement of the apartment?
Answer: Option C. -> 90 vehicles
:
C
In the table shown, each vehicle image represents 5 vehicles.
Number of vehicles in Row 1 =4×5 = 20vehicles.
Number of vehicles in Row 2 = 5×2 = 10 vehicles.
Number of vehicles in Row 3 = 4 × 5 = 20 vehicles.
Number of vehicles in Row 4 =5 ×5 = 25 vehicles.
Number of vehicles in Row 5=5×3 = 15 vehicles.
On adding all the vehicles in all the rows, we get
= 20 + 10 +20 + 25 + 15 = 90 Vehicles.
∴ 90 Vehicles are parked in the basement of theapartment.
:
A pictograph is a way of showing data using images. It is generally represented by showing images on vertical lines.
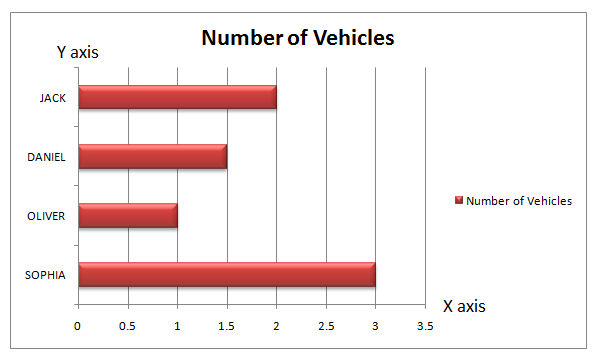
Question 23. Look at the graph shown, thickness of bars and gap between bars are identical, it shows details of vehicles purchased by members of the residences of same apartment during the year.
1 unit of length represents 2 vehicles purchased.
Number of Vehicles Purchased during the Year

Who has purchased the maximum number of vehicles during the year?
Here the horizontal axis is x axis which represents number of vehicles and vertical axis is y axis which represents name of people. The scale for y axis is 1 cm = 1 name and x axis 2 cm = 1 vehicle .
1 unit of length represents 2 vehicles purchased.
Number of Vehicles Purchased during the Year

Who has purchased the maximum number of vehicles during the year?
Here the horizontal axis is x axis which represents number of vehicles and vertical axis is y axis which represents name of people. The scale for y axis is 1 cm = 1 name and x axis 2 cm = 1 vehicle .
Answer: Option A. -> Sophia
:
A
By looking into the graph you can answer that Sophia has maximum number of cars during that year. Length of bar with respect to Sophia's shows largest, thus she has more number of vehicles than other members in the apartment.
:
A
By looking into the graph you can answer that Sophia has maximum number of cars during that year. Length of bar with respect to Sophia's shows largest, thus she has more number of vehicles than other members in the apartment.
Answer: Option B. -> False
:
B
Data is a collection of facts such as numbers, words, measurements, observations or even just descriptions of things while information is something that we get when we analyse data. Thus, data and information are not the same.
:
B
Data is a collection of facts such as numbers, words, measurements, observations or even just descriptions of things while information is something that we get when we analyse data. Thus, data and information are not the same.
Question 26. The marks obtained by Jessica are shown below. Jenny scored 15% more marks in English than Jessica. What was Jenny's score in English?
Here the horizontal axis is x axis which represents subjects and vertical axis is y axis which represents marks. x axis represents and the scale for y axis 1 cm = 10 marks.

Here the horizontal axis is x axis which represents subjects and vertical axis is y axis which represents marks. x axis represents and the scale for y axis 1 cm = 10 marks.

Answer: Option D. -> 69
:
D
From the graph we can see that Jessica's score for English is 60.
Jenny's score in English is 15% more than Jessica's.
⇒60+15%×60=60+15100×60
=60+9=69
∴ Jenny's score in English =69
:
D
From the graph we can see that Jessica's score for English is 60.
Jenny's score in English is 15% more than Jessica's.
⇒60+15%×60=60+15100×60
=60+9=69
∴ Jenny's score in English =69
:
Concept: 1 Mark
Solution: 1 Mark
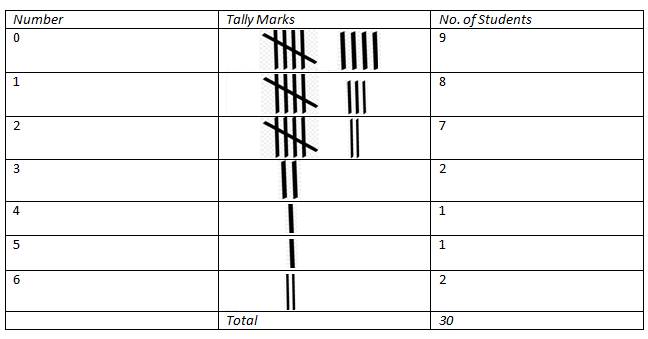
We can see from the above tally that every 5th mark is crossed.
∴ The count of straight lines = 5 + 2 = 7
The number of straight linesis 7.
Question 28. In a class of five students, the table shows the marks obtained by 5 students in Maths, Physics and Chemistry. Find the answer of the following questions. [4 MARKS]
a) Which roll no. secured maximum marks?
b) Are there any students who scored equal marks?
c) Who got least aggregate marks?
d) How much marks were scored by roll no. 4?
Roll No.MathsPhysicsChemistry16778672577875378647248460695697073
a) Which roll no. secured maximum marks?
b) Are there any students who scored equal marks?
c) Who got least aggregate marks?
d) How much marks were scored by roll no. 4?
Roll No.MathsPhysicsChemistry16778672577875378647248460695697073
:
Each option: 1 Mark
Marks scored by roll no. 1= 67 +78 + 67 = 212
Marks scored by roll no. 2 = 57 +78 +75 = 210
Marks scored by roll no.3 = 78 + 64 + 72 = 214
Marks scored by roll no. 4 = 84 + 60 + 69 = 213
Marks scored by roll no.5 = 69 + 70 + 73 = 212
a)Maximum marks is scored by roll no. 3 = 214
b)Yes, marks scored by both rollnumbers 1 and roll no. 5 are the same = 212
c)Least marks is scored by roll no. 2 = 210
d) Aggregate marks scored by roll no. 4 is 213
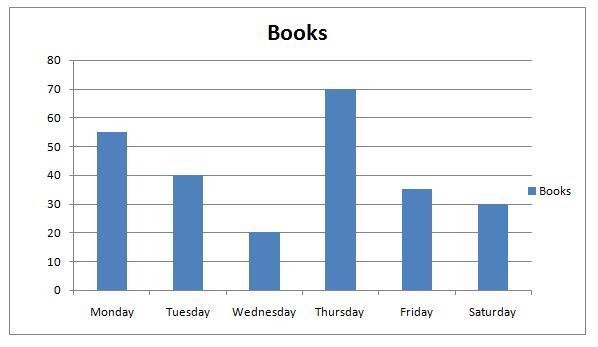
Question 29. The given table shows the number of science books sold on 6 consecutive days.
DaysNumber of books soldMonday55Tuesday40Wednesday20Thursday70Friday35Saturday30
To represent the above information, draw a graph by choosing a scale according to you.
On which day, the maximum number of books were sold? [3 MARKS]
DaysNumber of books soldMonday55Tuesday40Wednesday20Thursday70Friday35Saturday30
To represent the above information, draw a graph by choosing a scale according to you.
On which day, the maximum number of books were sold? [3 MARKS]
Question 30. The table shows the attendance of 1000 workers in an industry.
Answer the following questions.
DaysShift 1Shift 2Shift 3Monday300520Tuesday270470Wednesday350450Thursday400250Friday420330Saturday500250
a) Find the numbers of workers who worked on Tuesday in shift 2.
b) Find the total number of workers in shift 3.
c) Find the total number of workers in shift 2.
d) Find the total number of workers who worked on Saturday in shift 3.
[4 MARKS]
:
Each part: 1 Mark
Total numbers of workers in the industry is 1000
So, workers of shift 1+ workers of shift 2 + Workers of shift 3 =1000
Workers of shift 3 in Monday = 1000 - (300 + 520) = 180
Workers of shift 2 in Tuesday = 1000 - (270 + 470) = 260
Workers of shift 3 in Wednesday = 1000 - (350 + 450) = 200
Workers of shift 2 in Thursday = 1000 - (400 + 250) = 350
Workers of shift 1 in Friday = 1000 - (420 + 330) = 250
Workers of shift 3 in Saturday= 1000 - (500 + 250) = 250
a)The numbers of workers worked on Tuesday in shift 2 = 260
b)Numbers of workers in shift 2 =(520 + 260 + 450 + 350 + 420 + 250 ) = 2250
c)Total numbers of workers in shift 3 =( 180 + 470 + 200 + 250 + 330 + 250 ) = 1680
d) Total number of workers who worked on Saturday in shift 3 = 1000 - (500 + 250) = 250


