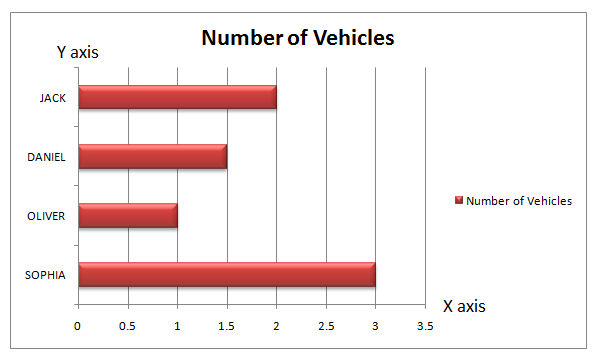
Look at the graph shown, thickness of bars and gap between bars are identical, it shows details of vehicles purchased by members of the residences of same apartment during the year.
1 unit of length represents 2 vehicles purchased.
Number of Vehicles Purchased during the Year
Who has purchased the maximum number of vehicles during the year?
Here the horizontal axis is x axis which represents number of vehicles and vertical axis is y axis which represents name of people. The scale for y axis is 1 cm = 1 name and x axis 2 cm = 1 vehicle .
:
A
By looking into the graph you can answer that Sophia has maximum number of cars during that year. Length of bar with respect to Sophia's shows largest, thus she has more number of vehicles than other members in the apartment.
Was this answer helpful ?


Submit Solution