Question
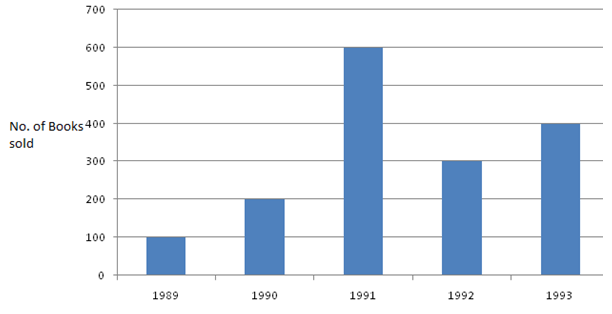
Following bar graph shows the number of books sold by a bookstore during five consecutive years. [3 MARKS]

a) In which year, 200 books were sold?
b) How many books were sold in the year 1989?
c) What is the difference between the number of books sold in 1993 and 1992?
a) In which year, 200 books were sold?
b) How many books were sold in the year 1989?
c) What is the difference between the number of books sold in 1993 and 1992?
Answer:
:
Each part: 1 Mark
The various inferences that we can draw from the above bar graph are:
In 1989 100 books were sold.
In 1990 200 books were sold.
In 1991 600 booksweresold.
In 1992 300 booksweresold.
In 1993 400 bookswere sold.
a) As we can see from the above bar graph, 200 books were sold in 1990.
b) In 1989, 100 books were sold.
c) Number of books sold in 1993 = 400
Number of books sold in 1992 = 300
∴ The difference in the number of books sold in 1993 and 1992 = 400 - 300 = 100.
Was this answer helpful ?
More Questions on This Topic :
Question 9.
Data and information are the same.
....


Submit Solution