6th Grade > Mathematics
DATA HANDLING MCQs
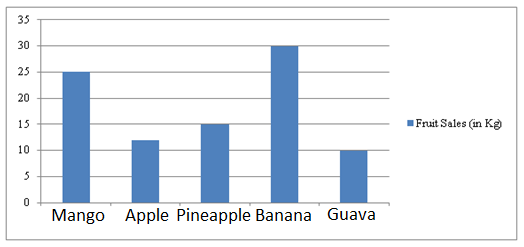
The following bar graph represents the sales of different fruits from a stall in a day. Find the difference in sales between the most and the least popular fruit.
Here the horizontal axis is x-axis and it represents fruits and the vertical axis is y-axis and it represents the fruits sold in kgs. x-axis represents fruits and the scale for y-axis, 1 cm = 5 kg. 
:
A
Organising data makes finding relevant information easier and hence makes the data more useful. Thus, the statement given above is true.
The bar graph below gives the strength of 'Section A' consecutively for 6 years since 2009, when it was Class 6, Section A. Each year, same students get promoted to next class. Also, some of the students get new admission and some of the students get transferred. So, the number of students varies accordingly.
Here the horizontal axis is x-axis which represents class and vertical axis is y-axis which represents number of students. The scale for x-axis is 1 cm = 1 class and y-axis 1 cm = 10 students.
How many students got admitted to the class at the start of session 2012 if nobody from the previous year batch took a transfer and 2 students were not promoted?
:
C
Number of students in the class in session 2011; Class 8 Section A = 40
If nobody took transfer and 2 students were not promoted, number of old students = 40 - 2 = 38
Number of students in the class in Session 2012; Class 9 Section A = 45
Number of new students = 45 - 38 = 7 students.
:
B
In the given pictograph it is mentioned that 1 bike picture is equal to 10 bikes. Therefore the month which has the maximum number of sales is January 2015. November 2014 is the month which was two months before January 2015.
For November 2014,
sales = 10+102=15
Thus, 15 bikes sold in November 2014, 2 months before the month which had the maximum number of bikes sold.


