6th Grade > Mathematics
DATA HANDLING MCQs
Total Questions : 94
| Page 2 of 10 pages
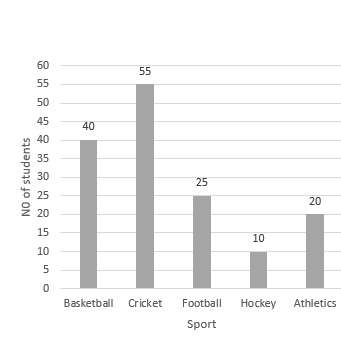
Question 11. A survey was done to find in which game students are interested in their free time. Total numbers of students were 150.
Name of GameNumber of StudentsBasketball40Cricket55Football25Hockey10Athletics20
Draw a graph to show the given information. Take a scale: 1 unit length = 5 students.
a) Which game is preferred maximum by the students?
b) Which game is preferred maximum after basketball?
[4 MARKS]
Name of GameNumber of StudentsBasketball40Cricket55Football25Hockey10Athletics20
Draw a graph to show the given information. Take a scale: 1 unit length = 5 students.
a) Which game is preferred maximum by the students?
b) Which game is preferred maximum after basketball?
[4 MARKS]
:
Frequency: 1 Mark
Maximum and minimum: 1 Mark
The frequency of an observation in a dataset is the number of times that observation has occurred in a data set. It is basically the total count of that observation in that data-set.
2 has the maximum frequency as it occurred four times.
3has the minimum frequency as it occurred once only
Answer: Option C. -> making it easy to analyse.
:
C
Organisation of data means arranging it in such a way that it is easy to analyse. If the data is in numeral form, it is advised to arrange it in either ascending or descending arrangement.
:
C
Organisation of data means arranging it in such a way that it is easy to analyse. If the data is in numeral form, it is advised to arrange it in either ascending or descending arrangement.
:
In pictographs, the information is represented in form of pictures of objects. The number of pictures shows the quantity of a given data.
:
If you count the number of hours, it is as:
English5 X 2 = 10 hoursMathematics7 X 2 = 14 hoursPhysics4 X 2 = 8 hoursChemistry3 X 2 = 6 hoursBiology4 X 2 = 8 hours
So, Mathematics takes most and Chemistry takes least.
Answer: Option A. -> True
:
A
Organising data makes finding relevant information easier and hence makes the data more useful. Thus, the statement given above is true.
:
A
Organising data makes finding relevant information easier and hence makes the data more useful. Thus, the statement given above is true.
Answer: Option B. -> False
:
B
Abar graphis a chart that usesbarsto show comparisons between categories of data. Thebarscan be either horizontal or vertical.Bar graphswith verticalbarsare sometimes called verticalbar graphs. In a bar graph, bars have a uniform width and uniform spacing between them. The bars of uniform width can be drawn horizontally or vertically depending upon convenience. Hence, the given statement is false.
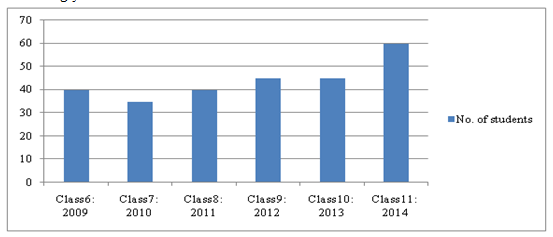
Question 18. The bar graph below gives the strength of 'Section A' consecutively for 6 years since 2009, when it was Class 6, Section A. Each year, same students get promoted to next class. Also, some of the students get new admission and some of the students get transferred. So, the number of students varies accordingly.
Here the horizontal axis is x-axis which represents class and vertical axis is y-axis which represents number of students. The scale for x-axis is 1 cm = 1 class and y-axis 1 cm = 10 students.

How many students got admitted to the class at the start of session 2012 if nobody from the previous year batch took a transfer and 2 students were not promoted?
Here the horizontal axis is x-axis which represents class and vertical axis is y-axis which represents number of students. The scale for x-axis is 1 cm = 1 class and y-axis 1 cm = 10 students.
How many students got admitted to the class at the start of session 2012 if nobody from the previous year batch took a transfer and 2 students were not promoted?
Answer: Option C. -> 7
:
C
Numberof students in the class in session 2011; Class 8 SectionA = 40
If nobody took transfer and 2 students were not promoted, number of old students = 40 - 2 = 38
Numberof students in the class in Session 2012; Class 9 SectionA = 45
Numberof new students = 45 - 38 = 7 students.
:
C
Numberof students in the class in session 2011; Class 8 SectionA = 40
If nobody took transfer and 2 students were not promoted, number of old students = 40 - 2 = 38
Numberof students in the class in Session 2012; Class 9 SectionA = 45
Numberof new students = 45 - 38 = 7 students.
Answer: Option B. -> 15
:
B
In the given pictograph it is mentioned that 1 bike picture is equal to 10 bikes.Therefore the month which has the maximum number ofsales is January 2015. November 2014 is the month which was two months before January 2015.
For November 2014,
sales = 10+102=15
Thus, 15 bikes sold in November 2014, 2 months before the month which had the maximum number of bikes sold.
Answer: Option B. -> VI 'B'
:
B
Class VI 'B'has arranged the marks in ascending order as
08 < 12 < 15 < 20 < 45 < 67 < 78 < 88 < 90 < 95
:
B
Class VI 'B'has arranged the marks in ascending order as
08 < 12 < 15 < 20 < 45 < 67 < 78 < 88 < 90 < 95


