6th Grade > Mathematics
DATA HANDLING MCQs
In a class of five students, the table shows the marks obtained by 5 students in Maths, Physics and Chemistry. Find the answer of the following questions. [4 MARKS]
a) Which roll no. secured maximum marks?
b) Are there any students who scored equal marks?
c) Who got least aggregate marks?
d) How much marks were scored by roll no. 4?
Roll No.MathsPhysicsChemistry16778672577875378647248460695697073
:
Each option: 1 Mark
Marks scored by roll no. 1 = 67 +78 + 67 = 212
Marks scored by roll no. 2 = 57 +78 +75 = 210
Marks scored by roll no.3 = 78 + 64 + 72 = 214
Marks scored by roll no. 4 = 84 + 60 + 69 = 213
Marks scored by roll no.5 = 69 + 70 + 73 = 212
a) Maximum marks is scored by roll no. 3 = 214
b) Yes, marks scored by both roll numbers 1 and roll no. 5 are the same = 212
c) Least marks is scored by roll no. 2 = 210
d) Aggregate marks scored by roll no. 4 is 213
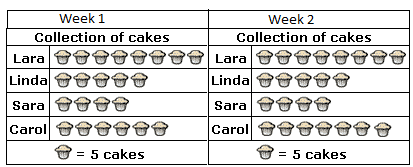
Collection of cakes by Lara, Linda, Sara and Carol in two weeks are given below.
a) The number of cakes Linda has by the end of two weeks.
b) The difference in the number of cakes between Carol and Linda by the end of two weeks.
c) Total numbers of cakes by all the members.
d) Difference between the highest and the lowest number of cake.
[4 MARKS]
:
Each option: 1 Mark
Above data, shows the numbers of cakes Lara, Linda, Sara and Carol have in two weeks.
Numbers of cakes Linda has = (5 + 5) ×5 = 50
Numbers of cakes Lara has = (8 + 8) ×5 = 80
Numbers of cakes Sara has = (4 + 4) ×5 = 40
Numbers of cakes Carol has = (6 + 7) ×5 = 65
a) Numbers of cakes Linda has is 50.
b) Numbers of cakes Carol has is 65
Difference in Carol and Linda = 65 - 50 = 15.
c) Total numbers of cakes =50 + 80 + 40 + 65 = 235.
d) Highest number of cake = 80
Lowest number of cake = 40
So, their difference is the = 80 - 40 = 40.
The table shows the attendance of 1000 workers in an industry.
Answer the following questions.
DaysShift 1Shift 2Shift 3Monday300520Tuesday270470Wednesday350450Thursday400250Friday420330Saturday500250
a) Find the numbers of workers who worked on Tuesday in shift 2.
b) Find the total number of workers in shift 3.
c) Find the total number of workers in shift 2.
d) Find the total number of workers who worked on Saturday in shift 3.
[4 MARKS]
:
Each part: 1 Mark
Total numbers of workers in the industry is 1000
So, workers of shift 1+ workers of shift 2 + Workers of shift 3 =1000
Workers of shift 3 in Monday = 1000 - (300 + 520) = 180
Workers of shift 2 in Tuesday = 1000 - (270 + 470) = 260
Workers of shift 3 in Wednesday = 1000 - (350 + 450) = 200
Workers of shift 2 in Thursday = 1000 - (400 + 250) = 350
Workers of shift 1 in Friday = 1000 - (420 + 330) = 250
Workers of shift 3 in Saturday= 1000 - (500 + 250) = 250
a) The numbers of workers worked on Tuesday in shift 2 = 260
b) Numbers of workers in shift 2 =(520 + 260 + 450 + 350 + 420 + 250 ) = 2250
c) Total numbers of workers in shift 3 =( 180 + 470 + 200 + 250 + 330 + 250 ) = 1680
d) Total number of workers who worked on Saturday in shift 3 = 1000 - (500 + 250) = 250
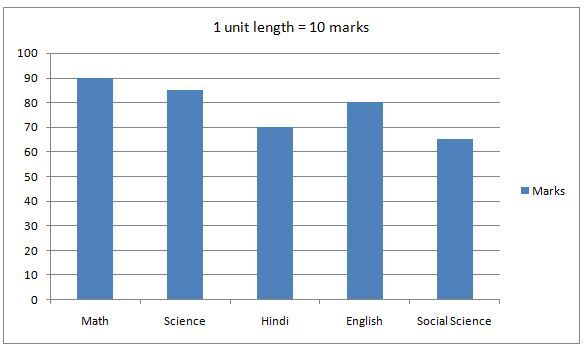
The graph given below shows the marks of Ashish in the mid-term exam in 5 subjects.
Answer the following questions from the bar graph:
a) The bar graph gives information about what?
b) Give the name of subject in which Ashish scored maximum marks.
c) Give the name of subject in which Ashish scored minimum marks.
d) Give the name of the subjects with the marks.
[4 MARKS]
:
Each option: 1 Mark
a) The bar graph gives information about the marks scored by Ashish in each subject.
b) Ashish scored maximum marks in Math. That is 90.
c) Ashish scored minimum marks in Social Science. That is 65.
d) Maths – 90
Science – 85
Hindi – 70
English – 80
Social Science – 65
:
A and C
Last name, height and weight of your friends are of course not relevant for planning the party. But according to the number of friends, you will get snacks, arrange for space etc. Also, if you know the expected amount to be spent on each friend, you can ask for sufficient money from your dad.
:
B
A bar graph is a chart that uses bars to show comparisons between categories of data. The bars can be either horizontal or vertical. Bar graphs with vertical bars are sometimes called vertical bar graphs. In a bar graph, bars have a uniform width and uniform spacing between them. The bars of uniform width can be drawn horizontally or vertically depending upon convenience. Hence, the given statement is false.
:
If you count the number of hours, it is as:
English5 X 2 = 10 hoursMathematics7 X 2 = 14 hoursPhysics4 X 2 = 8 hoursChemistry3 X 2 = 6 hoursBiology4 X 2 = 8 hours
So, Mathematics takes most and Chemistry takes least.
:
C
Organisation of data means arranging it in such a way that it is easy to analyse. If the data is in numeral form, it is advised to arrange it in either ascending or descending arrangement.
:
A
If you record the data in ascending or descending order, it will be organised and hence, it's analysis will be much easier.
:
In pictographs, the information is represented in form of pictures of objects. The number of pictures shows the quantity of a given data.


