Question
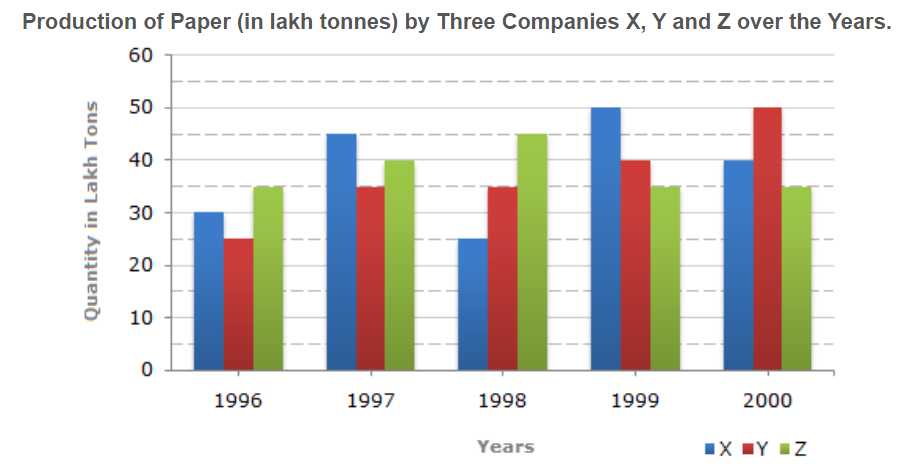
The bar graph given below shows the data of the production of paper (in lakh tonnes) by three different companies X, Y and Z over the years.
In which year was the percentage of production of Company Z to the production of Company Y the maximum?
In which year was the percentage of production of Company Z to the production of Company Y the maximum?

Answer: Option A
Answer: (a).1996
Was this answer helpful ?
Answer: (a).1996
Was this answer helpful ?


Submit Solution