Question
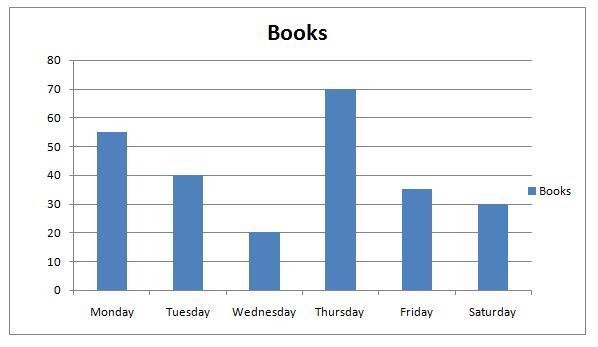
The given table shows the number of science books sold on 6 consecutive days.
DaysNumber of books soldMonday55Tuesday40Wednesday20Thursday70Friday35Saturday30
To represent the above information, draw a graph by choosing a scale according to you.
On which day, the maximum number of books were sold? [3 MARKS]
DaysNumber of books soldMonday55Tuesday40Wednesday20Thursday70Friday35Saturday30
To represent the above information, draw a graph by choosing a scale according to you.
On which day, the maximum number of books were sold? [3 MARKS]
More Questions on This Topic :
Question 7. Surveying is a mode of collecting data.....


Submit Solution