Question
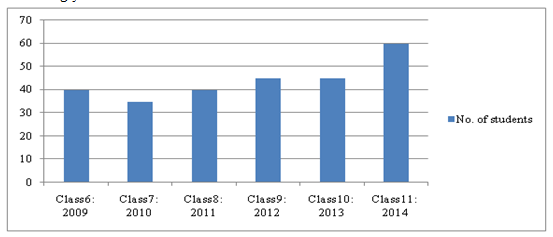
The bar graph below gives the strength of 'Section A' consecutively for 6 years since 2009, when it was Class 6, Section A. Each year, same students get promoted to next class. Also, some of the students get new admission and some of the students get transferred. So, the number of students varies accordingly.
Here the horizontal axis is x-axis which represents class and vertical axis is y-axis which represents number of students. The scale for x-axis is 1 cm = 1 class and y-axis 1 cm = 10 students.

How many students got admitted to the class at the start of session 2012 if nobody from the previous year batch took a transfer and 2 students were not promoted?
Here the horizontal axis is x-axis which represents class and vertical axis is y-axis which represents number of students. The scale for x-axis is 1 cm = 1 class and y-axis 1 cm = 10 students.
How many students got admitted to the class at the start of session 2012 if nobody from the previous year batch took a transfer and 2 students were not promoted?
Answer: Option C
:
C
Numberof students in the class in session 2011; Class 8 SectionA = 40
If nobody took transfer and 2 students were not promoted, number of old students = 40 - 2 = 38
Numberof students in the class in Session 2012; Class 9 SectionA = 45
Numberof new students = 45 - 38 = 7 students.
Was this answer helpful ?
More Questions on This Topic :
Question 7. Data and information are the same.....


Submit Solution