Question
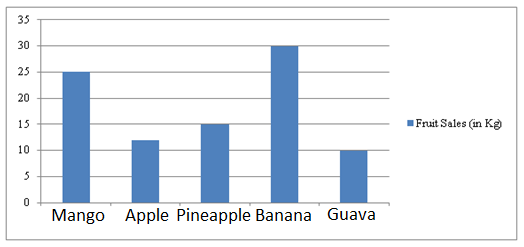
The following bar graph represents the sales of different fruits from a stall in a day. Find the difference in sales between the most and the least popular fruit.
Here the horizontal axis is x-axis and it represents fruits and the vertical axis is y-axis and it represents the fruits sold in kgs. x-axis represents fruits and the scale for y-axis, 1 cm = 5 kg. 
Answer: Option D
:
D
Was this answer helpful ?
:
D

The most popular fruit is 'Banana'
The quantities of Banana sold = 30 Kg
The most popular fruit is 'Guava'
The quantities of Guava sold = 10 Kg
Difference = 30 Kg - 10 Kg = 20 Kg
Hence, the difference in sales between the most popular fruit and least popular fruit is 20 Kg.
Was this answer helpful ?
More Questions on This Topic :
Question 1.
Organising data makes it easier to read.
....


Submit Solution