Question
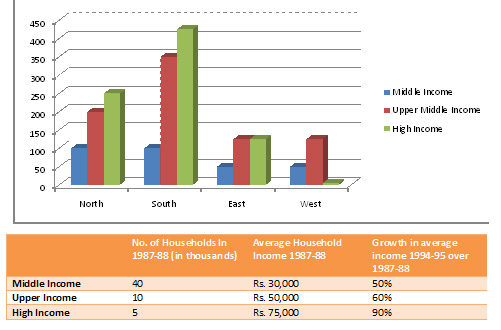
Directions (1 - 4) The following bar chart gives the growth percentage in the number of households in middle, upper-middle and high-income categories in the four regions for the period between 1987-88 and 1994-95.
What is the percentage increase in total number of households for the northern region (upper-middle) over the given period ?

What is the percentage increase in total number of households for the northern region (upper-middle) over the given period ?
Answer: Option B
The percentage increase in total number of households for the northern region for upper-middle income category is 200%.
Was this answer helpful ?
The percentage increase in total number of households for the northern region for upper-middle income category is 200%.
Was this answer helpful ?


Submit Solution