Sail E0 Webinar

Reasoning Aptitude > Data Interpretation

LINE GRAPH MCQs

Line Charts

Total Questions : 135 | Page 4 of 14 pages
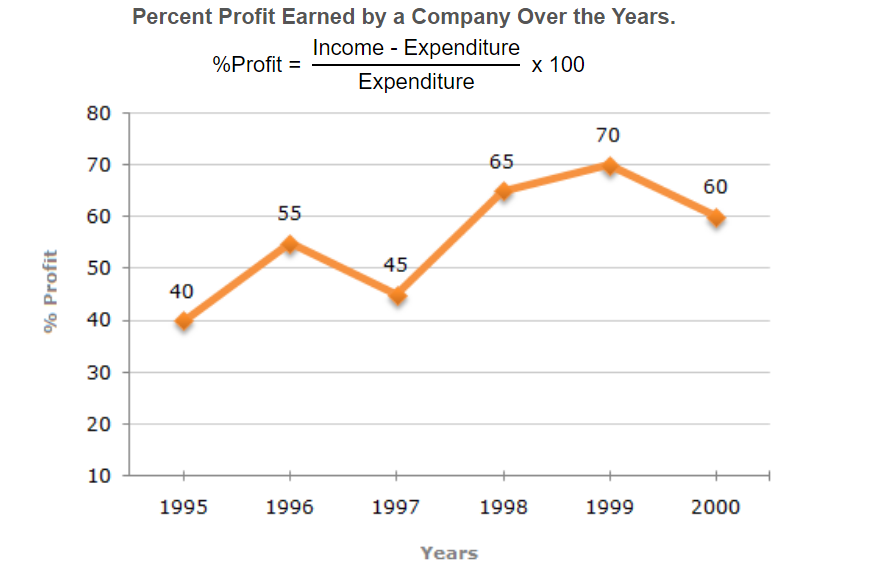
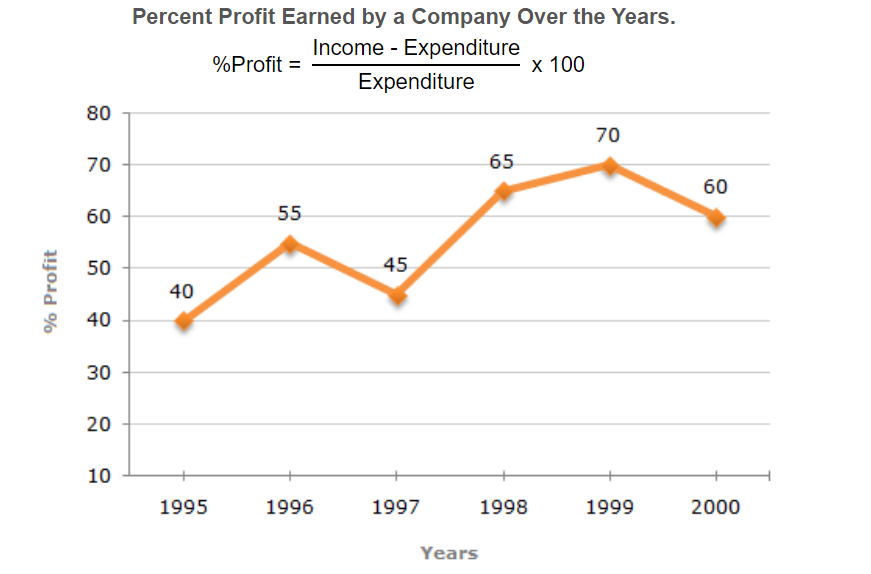
Question 31. The following line graph gives the annual percent profit earned by a Company during the period 1995 - 2000.
If the expenditures in 1996 and 1999 are equal, then the approximate ratio of the income in 1996 and 1999 respectively is?The Following Line Graph Gives The Annual Percent Profit Ear...
  1.    1:1
  2.    2:3
  3.    13:14
  4.    9:10
 Discuss Question
Answer: Option D. -> 9:10
Answer: (d).9:10
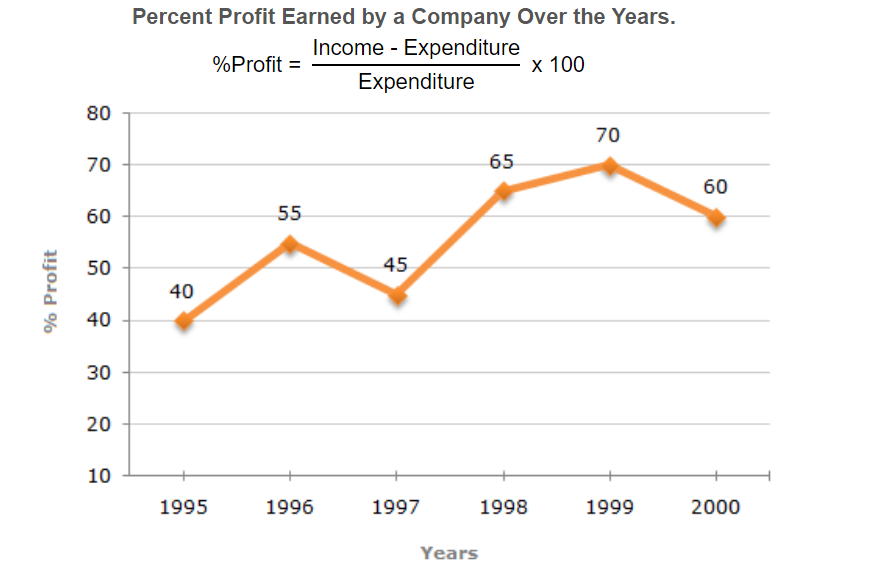
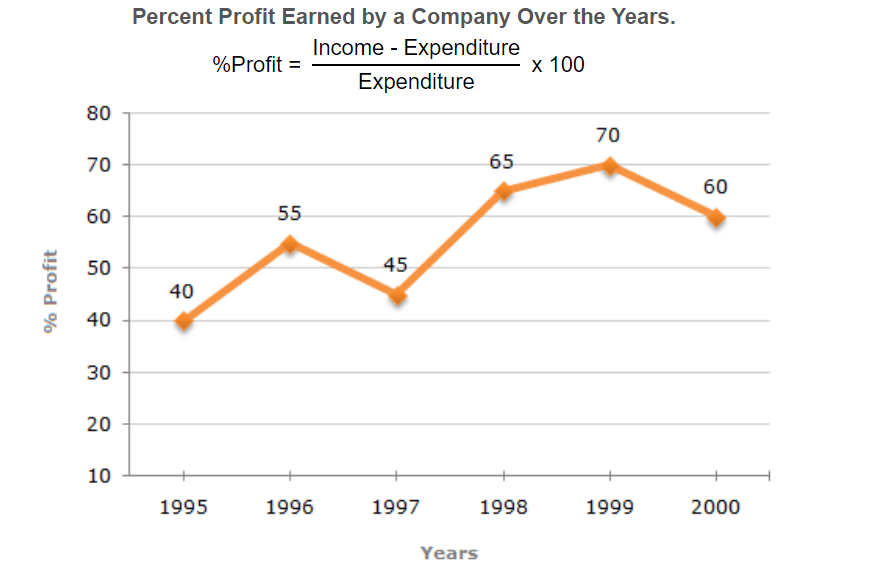
Question 32. The following line graph gives the annual percent profit earned by a Company during the period 1995 - 2000.
If the income in 1998 was Rs. 264 crores, what was the expenditure in 1998?The Following Line Graph Gives The Annual Percent Profit Ear...
  1.    Rs. 104 crores
  2.    Rs. 145 crores
  3.    Rs. 160 crores
  4.    Rs. 185 crores
 Discuss Question
Answer: Option C. -> Rs. 160 crores
Answer: (c).Rs. 160 crores
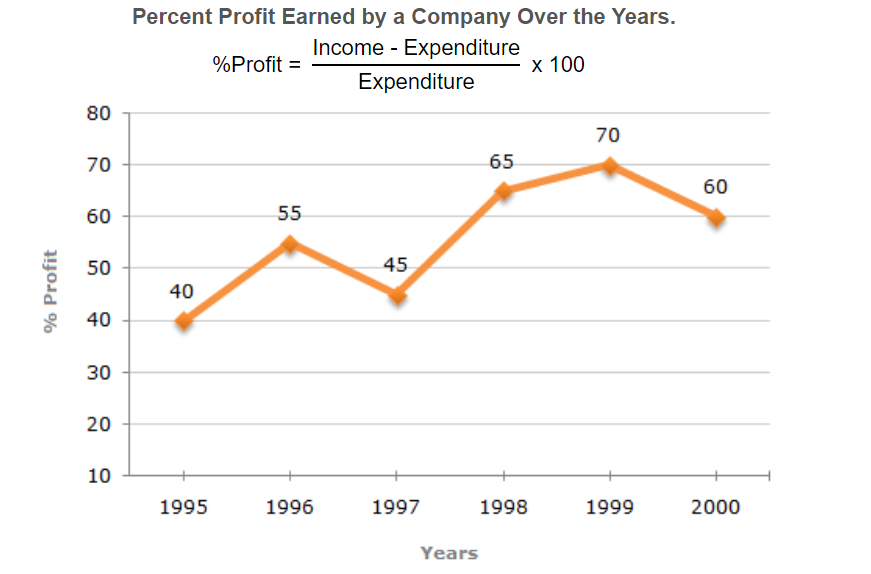
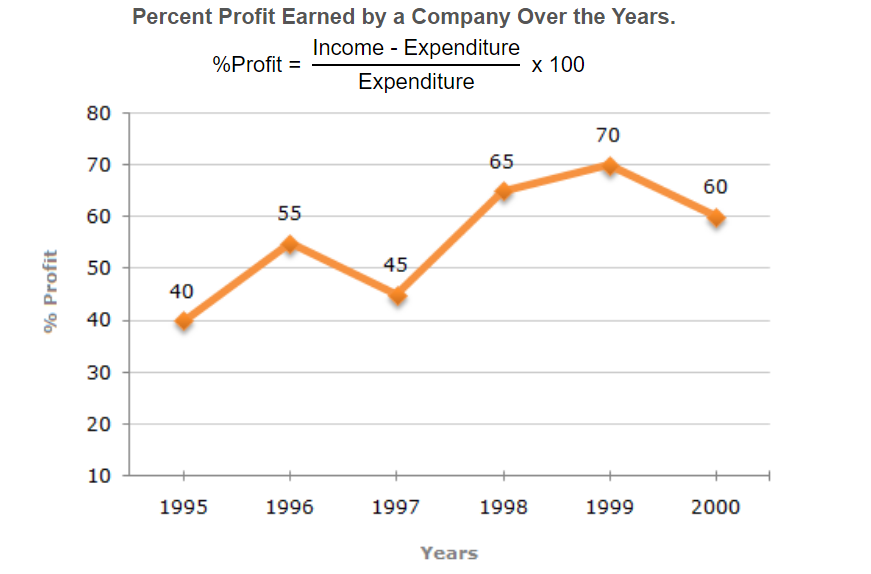
Question 33. The following line graph gives the annual percent profit earned by a Company during the period 1995 - 2000.
If the profit in 1999 was Rs. 4 crores, what was the profit in 2000?The Following Line Graph Gives The Annual Percent Profit Ear...
  1.    Rs. 4.2 crores
  2.    Rs. 6.6 crores
  3.    Rs. 6.8 crores
  4.    Cannot be determined
 Discuss Question
Answer: Option D. -> Cannot be determined
Answer: (d).Cannot be determined
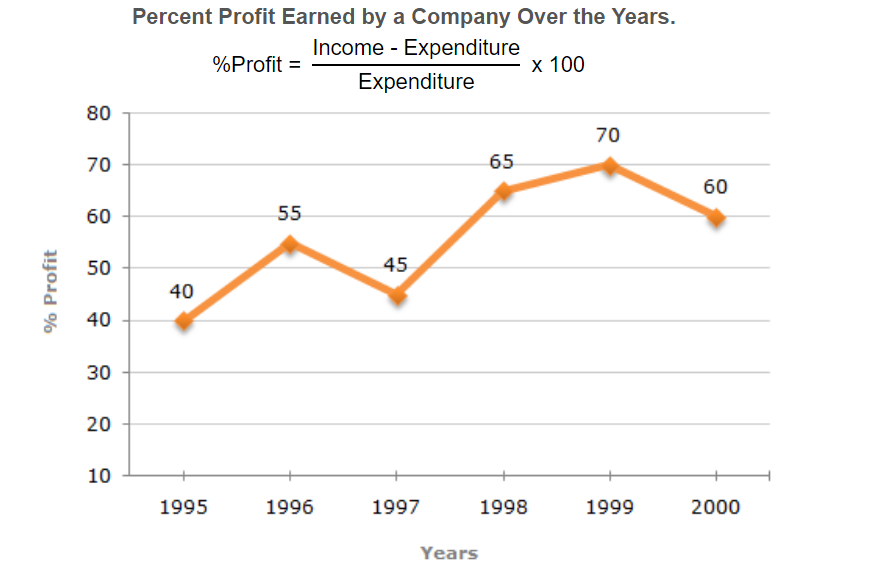
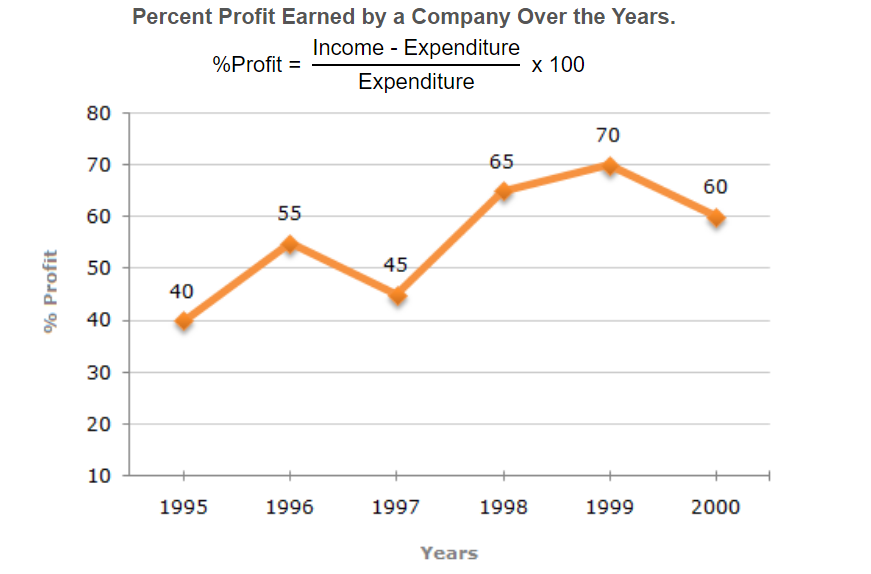
Question 34. The following line graph gives the annual percent profit earned by a Company during the period 1995 - 2000.
What is the average profit earned for the given years?The Following Line Graph Gives The Annual Percent Profit Ear...
  1.    50(2/3)
  2.    55(5/6)
  3.    60(1/6)
  4.    335
 Discuss Question
Answer: Option B. -> 55(5/6)
Answer: (b).55(5/6)
Question 35. The following line graph gives the annual percent profit earned by a Company during the period 1995 - 2000.
In which year is the expenditure minimum?The Following Line Graph Gives The Annual Percent Profit Ear...
  1.    2000
  2.    1997
  3.    1996
  4.    Cannot be determined
 Discuss Question
Answer: Option D. -> Cannot be determined
Answer: (d).Cannot be determined
Question 36. The following line graph gives the annual percent profit earned by a Company during the period 1995 - 2000.
If the expenditure in 2000 is 25% more than expenditure in 1997, then the income in 1997 is what percent less than the income in 2000?The Following Line Graph Gives The Annual Percent Profit Ear...
  1.    22.5%
  2.    25%
  3.    27.5%
  4.    31.25%
 Discuss Question
Answer: Option C. -> 27.5%
Answer: (c).27.5%
Question 37. The following line graph gives the annual percent profit earned by a Company during the period 1995 - 2000.
During which year the ratio of percentage profit earned to that in the previous year is the minimum?The Following Line Graph Gives The Annual Percent Profit Ear...
  1.    1996
  2.    1997
  3.    1998
  4.    1999
 Discuss Question
Answer: Option B. -> 1997
Answer: (b).1997
Question 38. The following line graph gives the annual percent profit earned by a Company during the period 1995 - 2000.
During which of the following year was the ratio of income to the expenditure the minimum?The Following Line Graph Gives The Annual Percent Profit Ear...
  1.    1996
  2.    1997
  3.    1998
  4.    1999
 Discuss Question
Answer: Option B. -> 1997
Answer: (b).1997
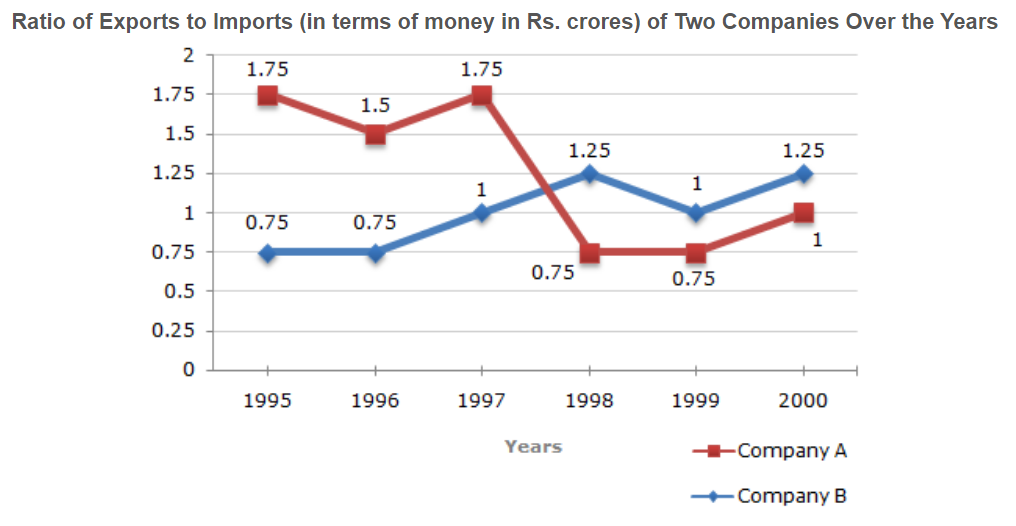
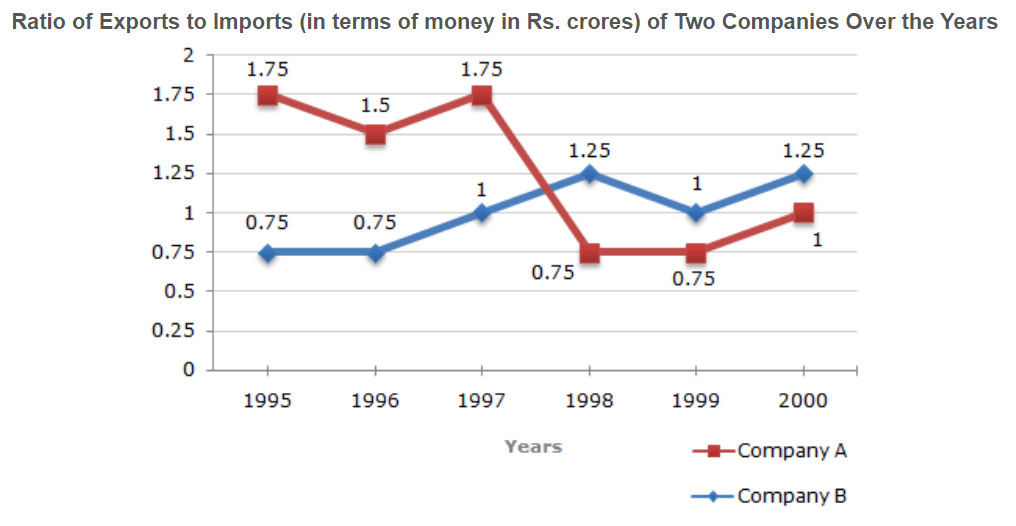
Question 39. Answer the question based on the given line graph.
In how many of the given years were the exports more than the imports for Company A?Answer The Question Based On The Given Line Graph.In How Man...
  1.    2
  2.    3
  3.    4
  4.    5
 Discuss Question
Answer: Option B. -> 3
Answer: (b).3
Question 40. Answer the question based on the given line graph.
If the imports of Company A in 1997 were increased by 40 percent, what would be the ratio of exports to the increased imports?Answer The Question Based On The Given Line Graph.If The Imp...
  1.    1.20
  2.    1.25
  3.    1.30
  4.    cannot be determined
 Discuss Question
Answer: Option B. -> 1.25
Answer: (b).1.25

Latest Videos

Latest Test Papers