Reasoning Aptitude > Data Interpretation
LINE GRAPH MCQs
Line Charts
Total Questions : 135
| Page 13 of 14 pages
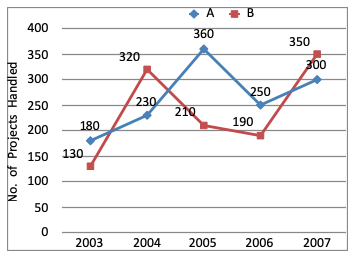
Question 121. Directions (1 - 5): Refer to the graph and answer the given questions:
The projects handled by a company can be broadly classified into two types: governmental projects and non-governmental projects. If the average number of non-governmental projects handles by the same company B in 2003 and 2004 is 127. What is the total number of governmental projects handled by the same company in 2003 and 2004 together?

The projects handled by a company can be broadly classified into two types: governmental projects and non-governmental projects. If the average number of non-governmental projects handles by the same company B in 2003 and 2004 is 127. What is the total number of governmental projects handled by the same company in 2003 and 2004 together?
Answer: Option D. -> 196
Average number of non-governmental projects handled by company B = 127
Number of Non-Governmental projects handled by company B in 2003 and 2004 is
= 127 × 2
= 254
Number of Governmental projects handled by company B in 2003 and 2004 together
= 130 + 320 - 254
= 450 - 254
= 196
Average number of non-governmental projects handled by company B = 127
Number of Non-Governmental projects handled by company B in 2003 and 2004 is
= 127 × 2
= 254
Number of Governmental projects handled by company B in 2003 and 2004 together
= 130 + 320 - 254
= 450 - 254
= 196
Answer: Option A. -> 378
Number of projects handled by company A in 2008
= 120% of 300
= $$\frac{120\times300}{100}$$
= 360
Number of projects handled by company A in 2009
= 105% of 360
= $$\frac{105\times360}{100}$$
= 378
Number of projects handled by company A in 2008
= 120% of 300
= $$\frac{120\times300}{100}$$
= 360
Number of projects handled by company A in 2009
= 105% of 360
= $$\frac{105\times360}{100}$$
= 378
Answer: Option D. -> Rs. 160
$$\eqalign{
& \text{Median} \cr
& = \frac{\text{L.V + H.V}}{2} \cr
& = \frac{120 + 200}{2} \cr
& = \text{Rs. }160 \cr}$$
$$\eqalign{
& \text{Median} \cr
& = \frac{\text{L.V + H.V}}{2} \cr
& = \frac{120 + 200}{2} \cr
& = \text{Rs. }160 \cr}$$
Answer: Option B. -> 16%
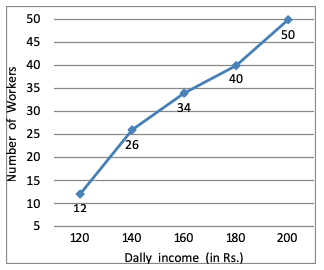
Wages numbers of workers
120 12
140 26 - 12 = 14
160 34 - 26 = 8
180 40 - 34 = 6
200 50 - 40 = 10
∴Required percentage
= $$\frac{8}{50}$$ × 100 = 16%
Wages numbers of workers
120 12
140 26 - 12 = 14
160 34 - 26 = 8
180 40 - 34 = 6
200 50 - 40 = 10
∴Required percentage
= $$\frac{8}{50}$$ × 100 = 16%
Answer: Option A. -> -3%
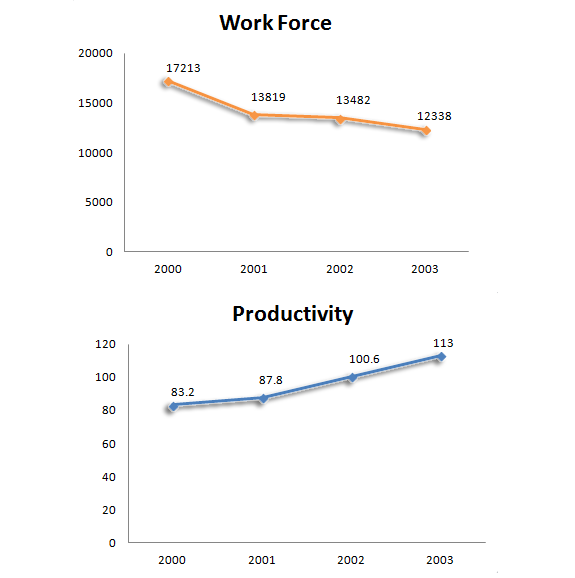
Change in production
= 12338 - 17213
= - 4875
% change
= $$\frac{\text{-}4875}{17213}\times100$$
= -2.9%
≈ -3%
Change in production
= 12338 - 17213
= - 4875
% change
= $$\frac{\text{-}4875}{17213}\times100$$
= -2.9%
≈ -3%
Answer: Option B. -> Productivity
Change in productivity
= 113 - 83.2
= 29.8
% change
= $$\frac{29.8}{83.2}\times100$$
= 35.8%
Change in productivity
= 113 - 83.2
= 29.8
% change
= $$\frac{29.8}{83.2}\times100$$
= 35.8%
Answer: Option B. -> Workforce and Production
Both the Workforce and Production have dropped.
Both the Workforce and Production have dropped.
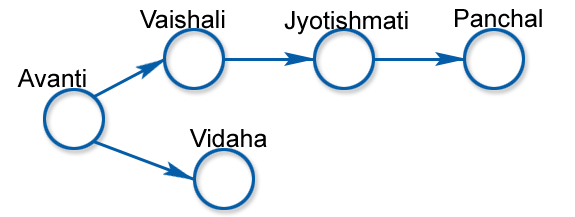
Question 128. Directions (1 - 3): The following sketch shows the pipeline carrying material from one location to another. Each location has a demand for material. The demand Vaishali is 400, at Jyotishmati is 400, at Panchal is 700 and Vidisha is 200. Each arrow indicates the direction of material flow through the pipeline. The flow from Vaishali to Jyotishmati is 300. The quantity of material flow is such that the demands at all these locations are exactly met. The capacity of each pipeline is 1.
What is free capacity available in Avanti-Vidisha pipeline ?

What is free capacity available in Avanti-Vidisha pipeline ?
Answer: Option D. -> 0
Quantity moved from Avanti to Vidisha pipeline is 100 and capacity is 1000. Hence, no free capacity is available.
Quantity moved from Avanti to Vidisha pipeline is 100 and capacity is 1000. Hence, no free capacity is available.
Question 129. Directions (1 - 3): The following sketch shows the pipeline carrying material from one location to another. Each location has a demand for material. The demand Vaishali is 400, at Jyotishmati is 400, at Panchal is 700 and Vidisha is 200. Each arrow indicates the direction of material flow through the pipeline. The flow from Vaishali to Jyotishmati is 300. The quantity of material flow is such that the demands at all these locations are exactly met. The capacity of each pipeline is 1.
Quantity moved Avanti to Vidisha is :

Quantity moved Avanti to Vidisha is :
Answer: Option D. -> 1000
Jyotishmati gets supply from two direction one from Vaishali max 300 and rest from Vidisha. all supply given to Panchal is received and supplies 100 for Jyotishmati because it receives only 300 (max flow) from Vaishali.
Hence, quantity moved from Avanti to Vidisha,
= 200 + 100 + 700
= 1000
Jyotishmati gets supply from two direction one from Vaishali max 300 and rest from Vidisha. all supply given to Panchal is received and supplies 100 for Jyotishmati because it receives only 300 (max flow) from Vaishali.
Hence, quantity moved from Avanti to Vidisha,
= 200 + 100 + 700
= 1000
Question 130. Directions (1 - 3): The following sketch shows the pipeline carrying material from one location to another. Each location has a demand for material. The demand Vaishali is 400, at Jyotishmati is 400, at Panchal is 700 and Vidisha is 200. Each arrow indicates the direction of material flow through the pipeline. The flow from Vaishali to Jyotishmati is 300. The quantity of material flow is such that the demands at all these locations are exactly met. The capacity of each pipeline is 1.
The free capacity available at the Avanti-Vaishali pipeline is :

The free capacity available at the Avanti-Vaishali pipeline is :
Answer: Option D. -> 300
Capacity of pipelines is 1,000. It supplies 300 to Jyotishmati through Vaishali, gives to Vaishali and balance 300 is kept free in Avanti-vaishali pipeline.
Capacity of pipelines is 1,000. It supplies 300 to Jyotishmati through Vaishali, gives to Vaishali and balance 300 is kept free in Avanti-vaishali pipeline.


