Question
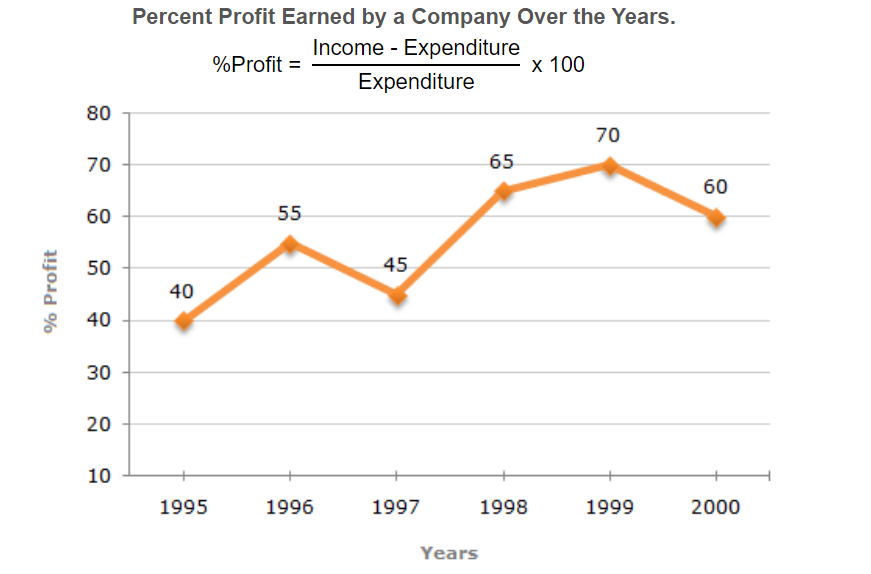
The following line graph gives the annual percent profit earned by a Company during the period 1995 - 2000.
In which year is the expenditure minimum?
In which year is the expenditure minimum?

Answer: Option D
Answer: (d).Cannot be determined
Was this answer helpful ?
Answer: (d).Cannot be determined
Was this answer helpful ?


Submit Solution