Sail E0 Webinar

Reasoning Aptitude > Data Interpretation

LINE GRAPH MCQs

Line Charts

Total Questions : 135 | Page 5 of 14 pages
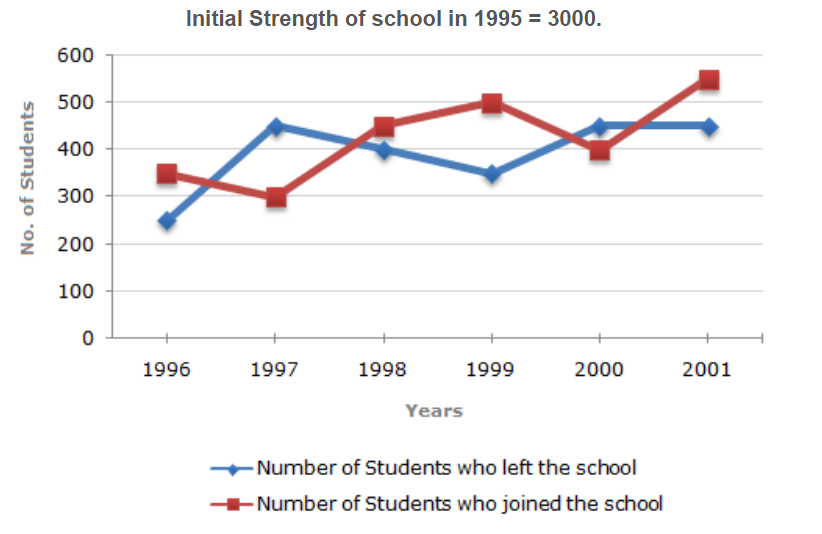
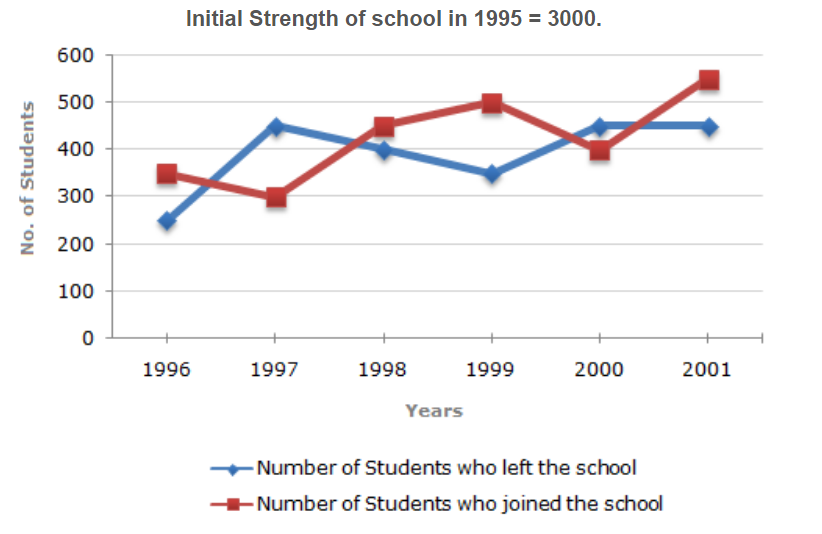
Question 41. Study the following line graph which gives the number of students who joined and left the school in the beginning of year for six years, from 1996 to 2001.
The strength of school increased/decreased from 1997 to 1998 by approximately what percent?Study The Following Line Graph Which Gives The Number Of Stu...
  1.    1.2%
  2.    1.7%
  3.    2.1%
  4.    2.4%
 Discuss Question
Answer: Option B. -> 1.7%
Answer: (b).1.7%
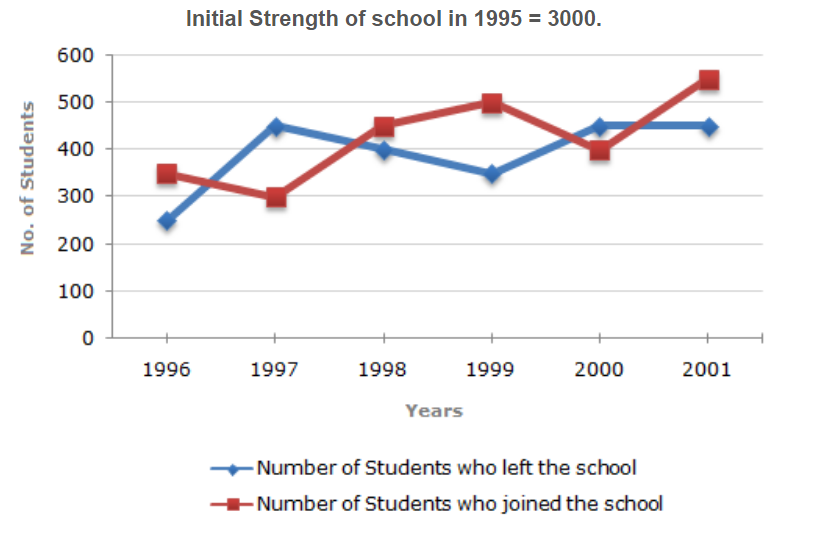
Question 42. Study the following line graph which gives the number of students who joined and left the school in the beginning of year for six years, from 1996 to 2001.
The number of students studying in the school in 1998 was what percent of the number of students studying in the school in 2001?Study The Following Line Graph Which Gives The Number Of Stu...
  1.    92.13%
  2.    93.75%
  3.    96.88%
  4.    97.25%
 Discuss Question
Answer: Option B. -> 93.75%
Answer: (b).93.75%
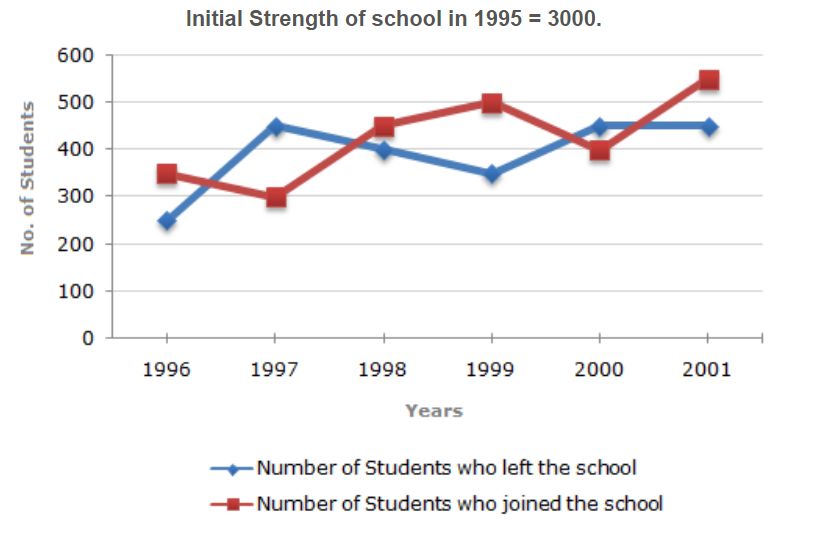
Question 43. Study the following line graph which gives the number of students who joined and left the school in the beginning of year for six years, from 1996 to 2001.
During which of the following pairs of years, the strength of the school was same?Study The Following Line Graph Which Gives The Number Of Stu...
  1.    1999 and 2001
  2.    1998 and 2000
  3.    1997 and 1998
  4.    1996 and 2000
 Discuss Question
Answer: Option D. -> 1996 and 2000
Answer: (d).1996 and 2000
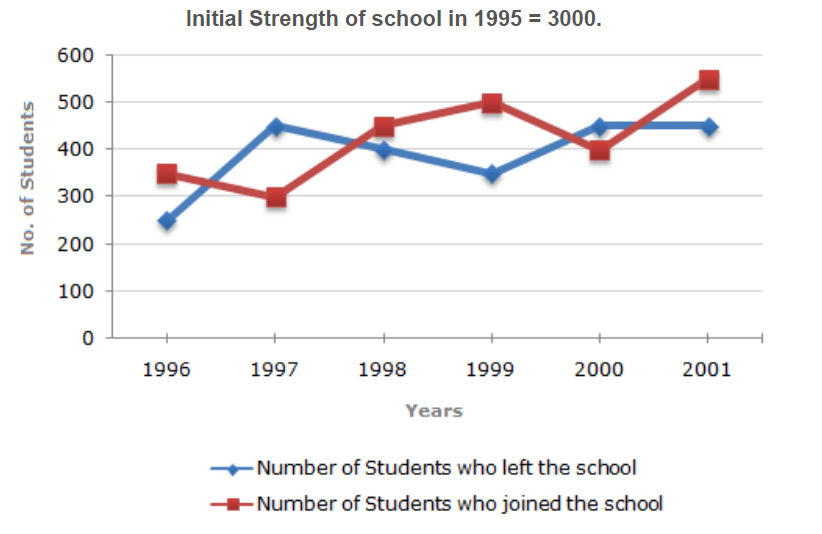
Question 44. Study the following line graph which gives the number of students who joined and left the school in the beginning of year for six years, from 1996 to 2001.
The ratio of the least number of students who joined the school to the maximum number of students who left the school in any of the years during the given period is?Study The Following Line Graph Which Gives The Number Of Stu...
  1.    7:9
  2.    4:5
  3.    3:4
  4.    2:3
 Discuss Question
Answer: Option D. -> 2:3
Answer: (d).2:3
Question 45. Study the following line graph which gives the number of students who joined and left the school in the beginning of year for six years, from 1996 to 2001.
Among the given years, the largest number of students joined the school in the year?Study The Following Line Graph Which Gives The Number Of Stu...
  1.    1996
  2.    1998
  3.    2001
  4.    2000
 Discuss Question
Answer: Option C. -> 2001
Answer: (c).2001
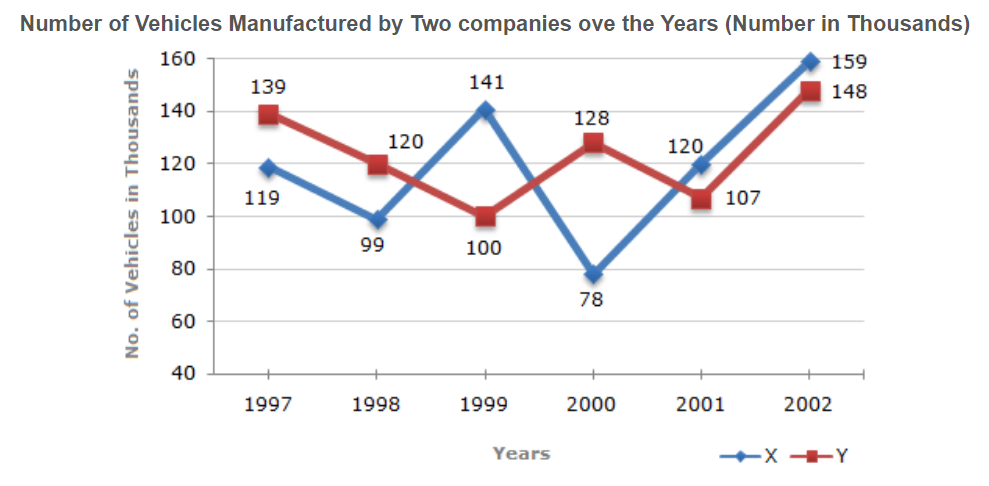
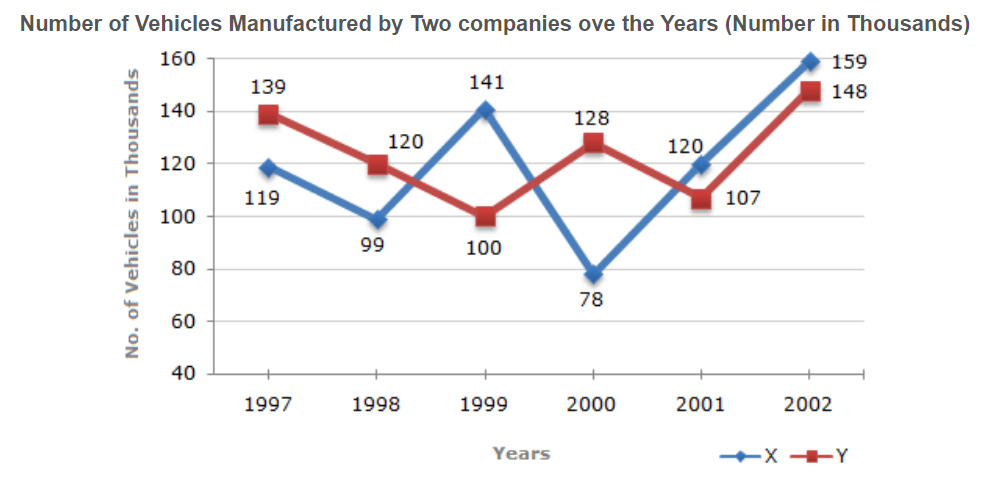
Question 46. Study the following line graph and answer the question based on it.
What is the difference between the number of vehicles manufactured by Company Y in 2000 and 2001 ?Study The Following Line Graph And Answer The Question Based...
  1.    50000
  2.    42000
  3.    33000
  4.    21000
 Discuss Question
Answer: Option D. -> 21000
Answer: (d).21000
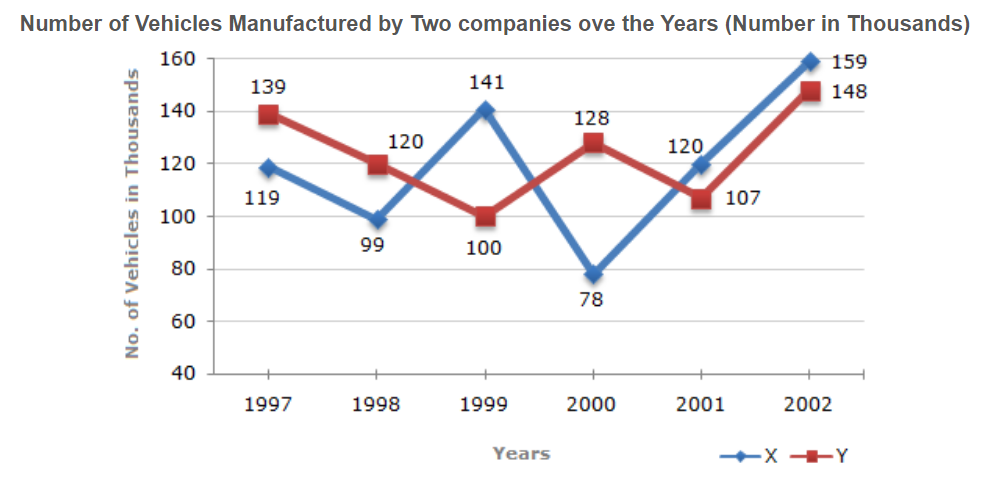
Question 47. Study the following line graph and answer the question based on it.
What is the average numbers of vehicles manufactured by Company X over the given period ? (rounded off to nearest integer)Study The Following Line Graph And Answer The Question Based...
  1.    119333
  2.    113666
  3.    112778
  4.    111223
 Discuss Question
Answer: Option A. -> 119333
Answer: (a).119333
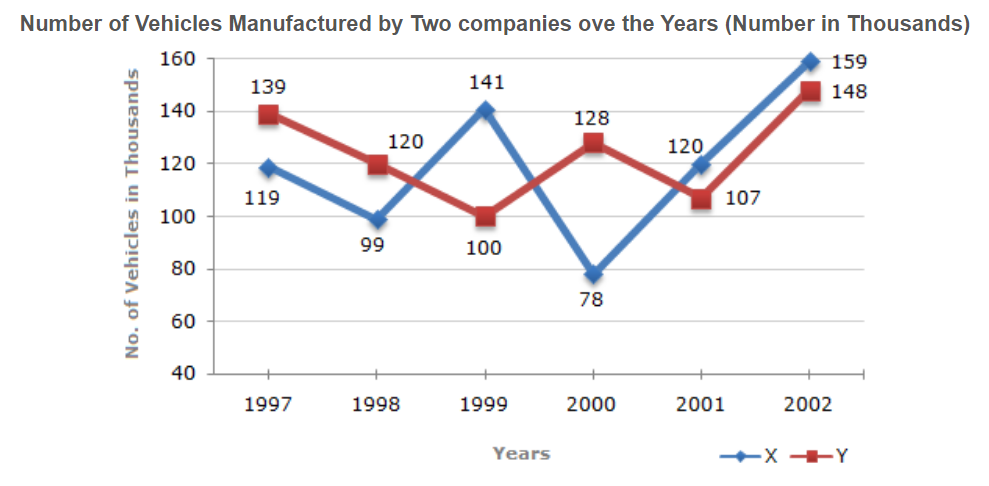
Question 48. Study the following line graph and answer the question based on it.
What is the difference between the total productions of the two Companies in the given years ?Study The Following Line Graph And Answer The Question Based...
  1.    19000
  2.    22000
  3.    26000
  4.    28000
 Discuss Question
Answer: Option C. -> 26000
Answer: (c).26000
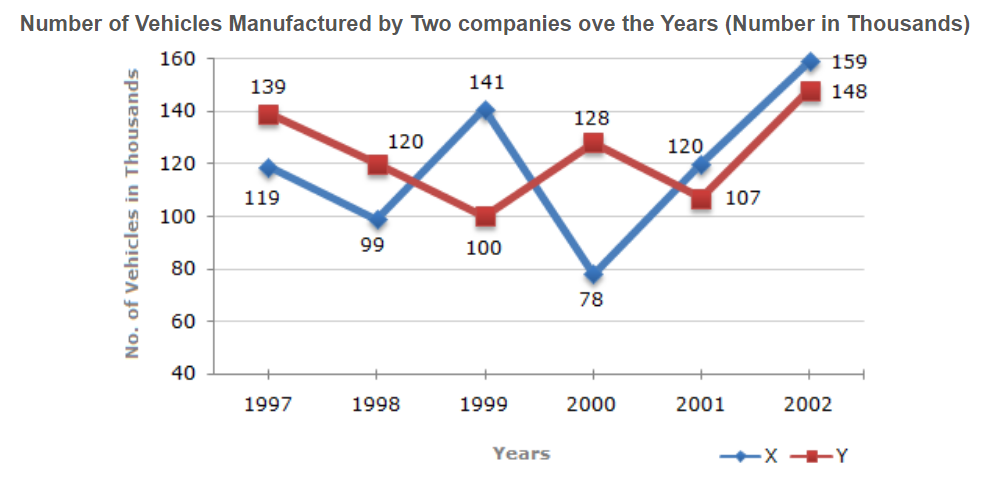
Question 49. Study the following line graph and answer the question based on it.
The production of Company Y in 2000 was approximately what percent of the production of Company X in the same year ?Study The Following Line Graph And Answer The Question Based...
  1.    173
  2.    164
  3.    132
  4.    97
 Discuss Question
Answer: Option B. -> 164
Answer: (b).164
Question 50. Study the following line graph and answer the question based on it.
In which of the following years, the difference between the productions of Companies X and Y was the maximum among the given years ?Study The Following Line Graph And Answer The Question Based...
  1.    1997
  2.    1998
  3.    1999
  4.    2000
 Discuss Question
Answer: Option D. -> 2000
Answer: (d).2000

Latest Videos

Latest Test Papers