Reasoning Aptitude > Data Interpretation
LINE GRAPH MCQs
Line Charts
Total Questions : 135
| Page 3 of 14 pages
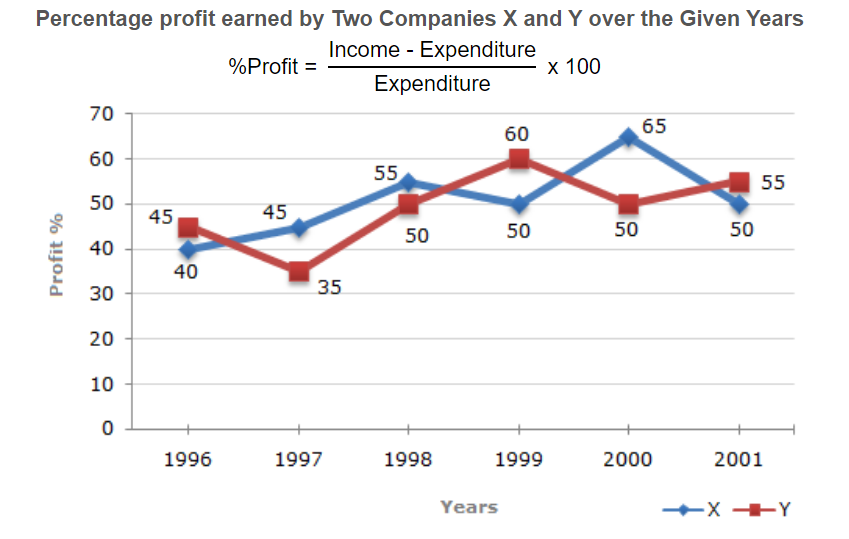
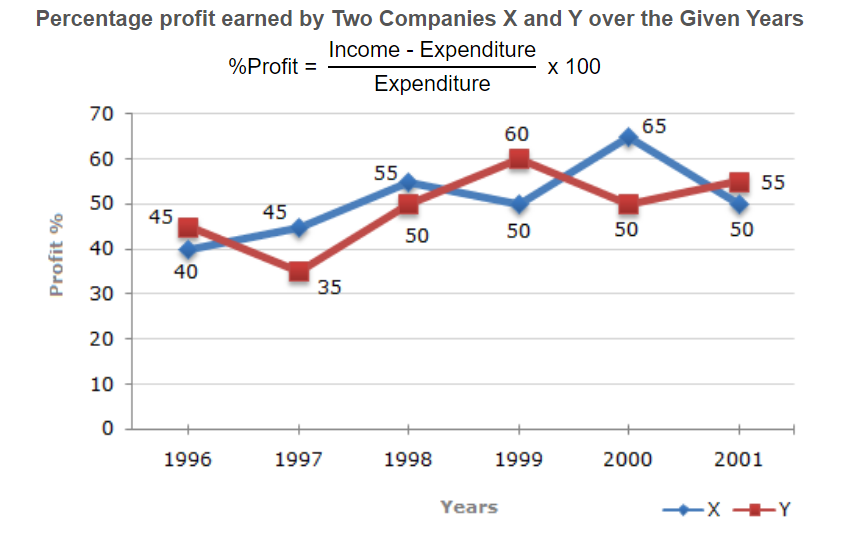
Question 21. The following line graph gives the percent profit earned by two Companies X and Y during the period 1996 - 2001.
If the expenditures of Company X and Y in 1996 were equal and the total income of the two Companies in 1996 was Rs. 342 crores, what was the total profit of the two Companies together in 1996 ? (Profit = Income - Expenditure)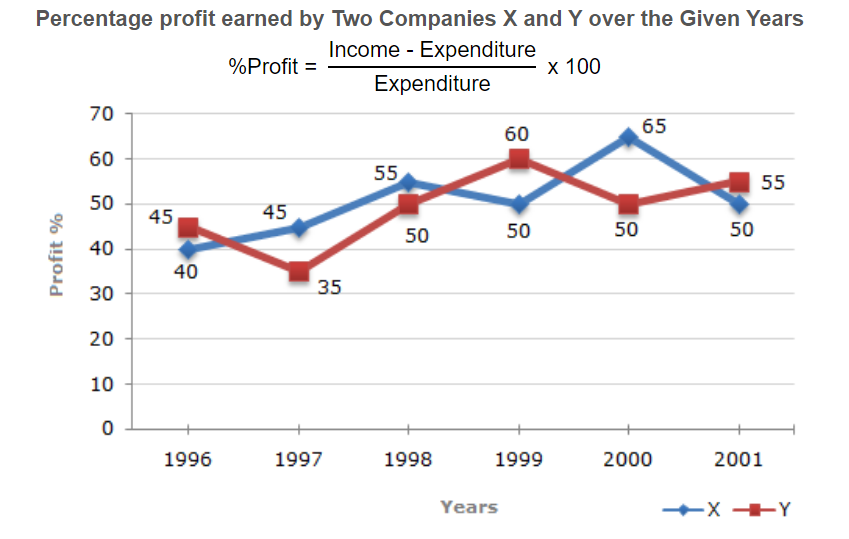
If the expenditures of Company X and Y in 1996 were equal and the total income of the two Companies in 1996 was Rs. 342 crores, what was the total profit of the two Companies together in 1996 ? (Profit = Income - Expenditure)

Answer: Option D. -> Rs. 102 crores
Answer: (d).Rs. 102 crores
Answer: (d).Rs. 102 crores
Answer: Option C. -> 15:22
Answer: (c).15:22
Answer: (c).15:22
Answer: Option B. -> Rs. 297 crores
Answer: (b).Rs. 297 crores
Answer: (b).Rs. 297 crores
Answer: Option D. -> 16:15
Answer: (d).16:15
Answer: (d).16:15
Question 25. The following line graph gives the percent profit earned by two Companies X and Y during the period 1996 - 2001.
The expenditure of Company X in the year 1998 was Rs. 200 crores and the income of company X in 1998 was the same as its expenditure in 2001. The income of Company X in 2001 was ?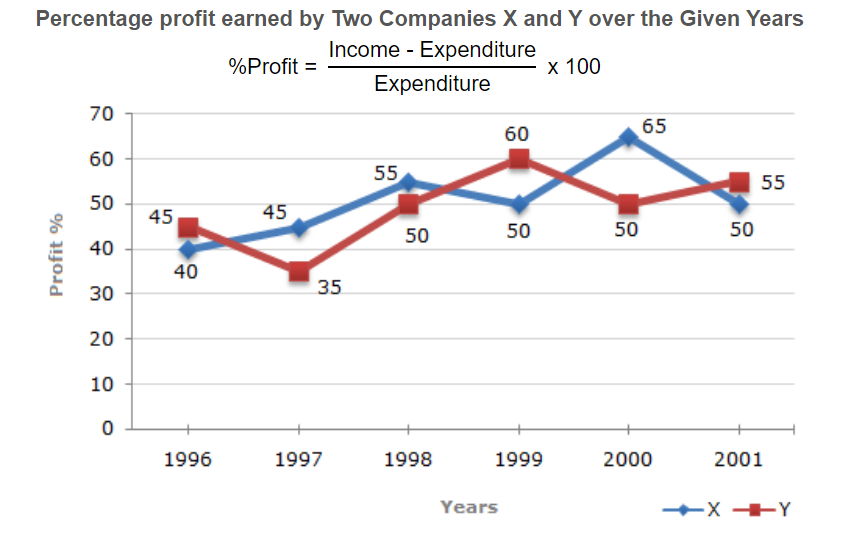
The expenditure of Company X in the year 1998 was Rs. 200 crores and the income of company X in 1998 was the same as its expenditure in 2001. The income of Company X in 2001 was ?

Answer: Option A. -> Rs. 465 crores
Answer: (a).Rs. 465 crores
Answer: (a).Rs. 465 crores
Question 26. The following line graph gives the percentage of the number of candidates who qualified an examination out of the total number of candidates who appeared for the examination over a period of seven years from 1994 to 2000.
The difference between the percentage of candidates qualified to appeared was maximum in which of the following pairs of years?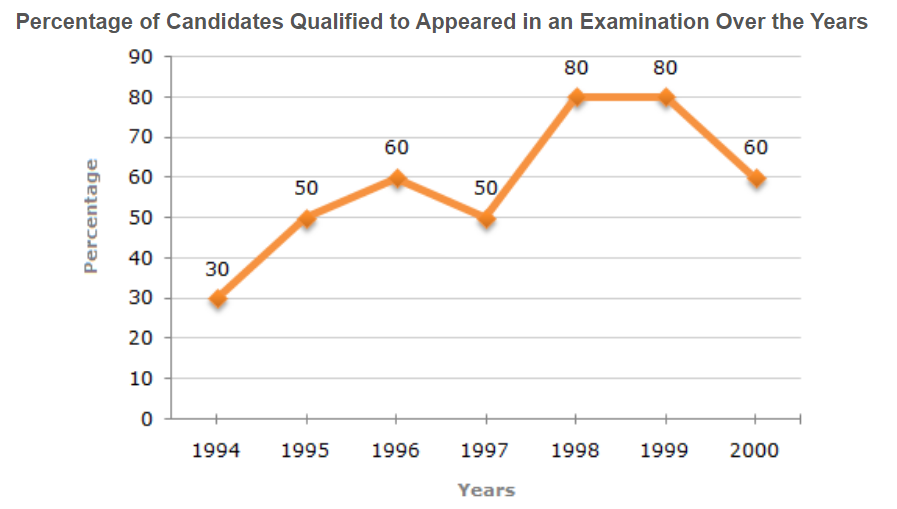
The difference between the percentage of candidates qualified to appeared was maximum in which of the following pairs of years?

Answer: Option B. -> 1997 and 1998
Answer: (b).1997 and 1998
Answer: (b).1997 and 1998
Question 27. The following line graph gives the percentage of the number of candidates who qualified an examination out of the total number of candidates who appeared for the examination over a period of seven years from 1994 to 2000.
In which pair of years was the number of candidates qualified, the same?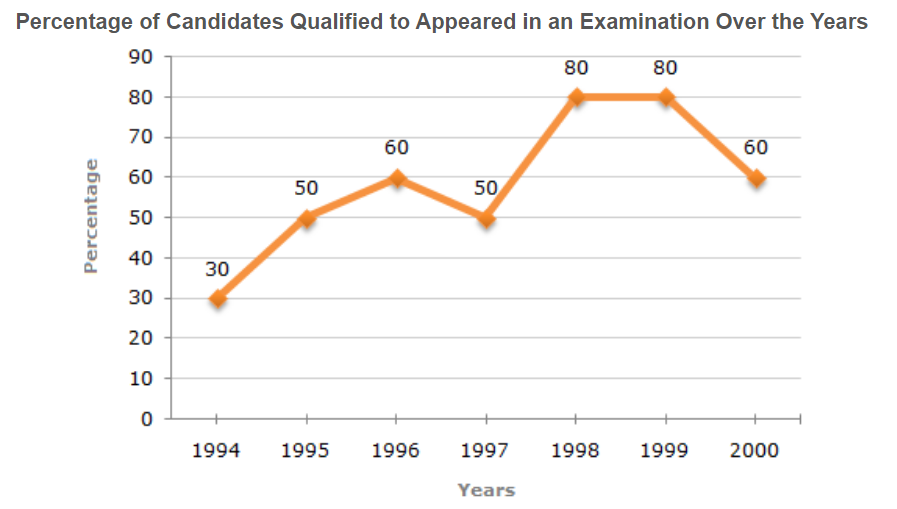
In which pair of years was the number of candidates qualified, the same?

Answer: Option D. -> Data inadequate
Answer: (d).Data inadequate
Answer: (d).Data inadequate
Question 28. The following line graph gives the percentage of the number of candidates who qualified an examination out of the total number of candidates who appeared for the examination over a period of seven years from 1994 to 2000.
The total number of candidates qualified in 1999 and 2000 together was 33500 and the number of candidates appeared in 1999 was 26500. What was the number of candidates in 2000?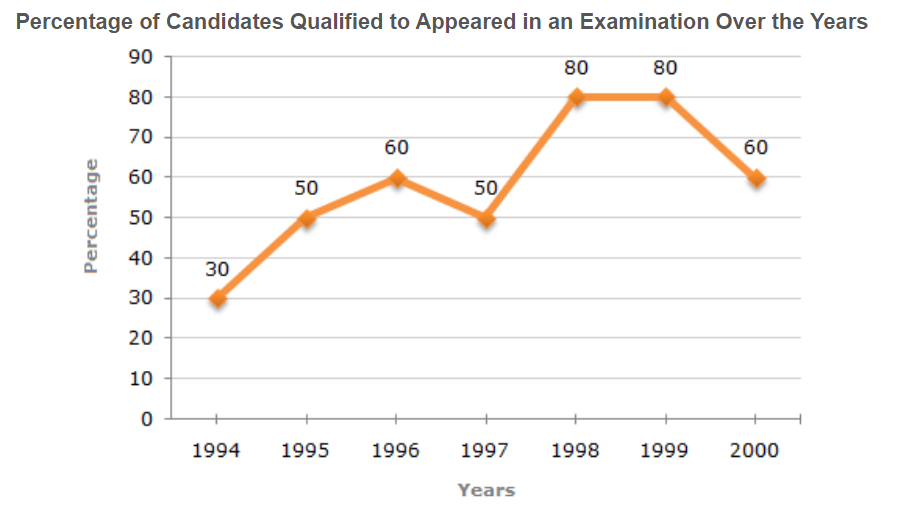
The total number of candidates qualified in 1999 and 2000 together was 33500 and the number of candidates appeared in 1999 was 26500. What was the number of candidates in 2000?

Answer: Option C. -> 20500
Answer: (c).20500
Answer: (c).20500
Question 29. The following line graph gives the percentage of the number of candidates who qualified an examination out of the total number of candidates who appeared for the examination over a period of seven years from 1994 to 2000.
If the number of candidates qualified in 1998 was 21200, what was the number of candidates appeared in 1998?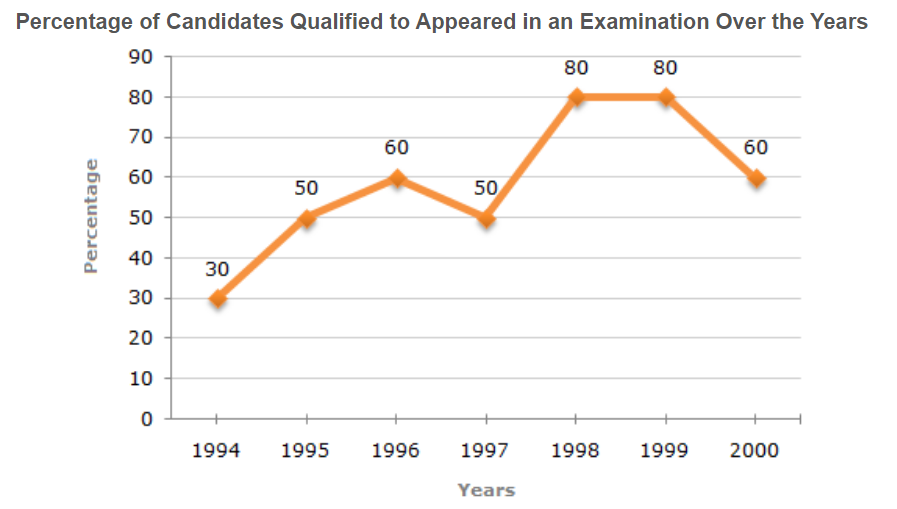
If the number of candidates qualified in 1998 was 21200, what was the number of candidates appeared in 1998?

Answer: Option C. -> 26500
Answer: (c).26500
Answer: (c).26500
Question 30. The following line graph gives the percentage of the number of candidates who qualified an examination out of the total number of candidates who appeared for the examination over a period of seven years from 1994 to 2000.
If the total number of candidates appeared in 1996 and 1997 together was 47400, then the total number of candidates qualified in these two years together was?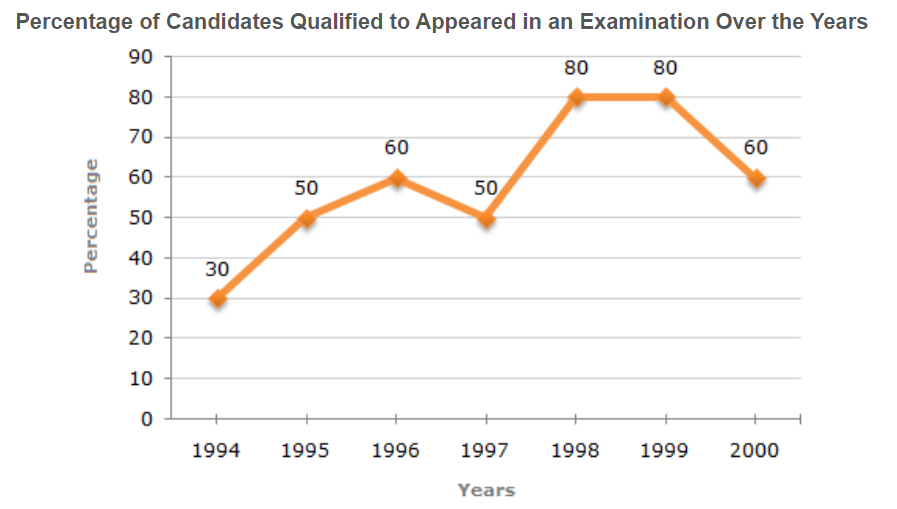
If the total number of candidates appeared in 1996 and 1997 together was 47400, then the total number of candidates qualified in these two years together was?

Answer: Option D. -> Data inadequate
Answer: (d).Data inadequate
Answer: (d).Data inadequate

