Reasoning Aptitude > Data Interpretation
LINE GRAPH MCQs
Line Charts
Total Questions : 135
| Page 14 of 14 pages
Answer: Option B. -> 73%
$$\eqalign{
& \text{Required %} \cr
& = \left(\frac{400}{550}\times100\right)\% \cr
& = \frac{800}{11}\% \cr
& = 72.7\% \cr
& \approx 73\% \cr} $$
$$\eqalign{
& \text{Required %} \cr
& = \left(\frac{400}{550}\times100\right)\% \cr
& = \frac{800}{11}\% \cr
& = 72.7\% \cr
& \approx 73\% \cr} $$
Answer: Option B. -> 64 : 55
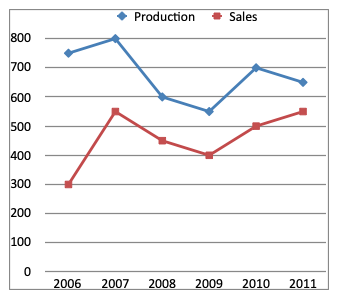
Total production of Company A
= (750 + 800 + 600 + 550 + 700 + 650) tonnes
= 4050 tonnes
Total sales of Company A
= (300 + 550 + 450 + 400 + 500 + 550) tonnes
= 2750 tonnes
∴ Required ratio
= 4050 : 2750
= 81 : 55
Total production of Company A
= (750 + 800 + 600 + 550 + 700 + 650) tonnes
= 4050 tonnes
Total sales of Company A
= (300 + 550 + 450 + 400 + 500 + 550) tonnes
= 2750 tonnes
∴ Required ratio
= 4050 : 2750
= 81 : 55
Answer: Option C. -> 3 : 4
Production of Company B in 2006
= $$\left(\frac{4}{5}\text{ of } 750\right) \text{tonnes}$$
= 600 tonnes
Production of Company B in 2008
= $$\left(\frac{4}{3}\text{ of } 600\right) \text{tonnes}$$
= 800 tonnes
∴ Required ratio
= 600 : 800
= 3 : 4
Production of Company B in 2006
= $$\left(\frac{4}{5}\text{ of } 750\right) \text{tonnes}$$
= 600 tonnes
Production of Company B in 2008
= $$\left(\frac{4}{3}\text{ of } 600\right) \text{tonnes}$$
= 800 tonnes
∴ Required ratio
= 600 : 800
= 3 : 4
Answer: Option D. -> 27%
Percentage increase in production of A from 2009 to 2010
$$\eqalign{
& = \left(\frac{700-550}{550}\times100\right)\% \cr
& = \left(\frac{150}{550}\times100\right)\% \cr
& = \frac{300}{11}\% \cr
& = 27.2\% \cr
& \approx 27\% \cr} $$
Percentage increase in production of A from 2009 to 2010
$$\eqalign{
& = \left(\frac{700-550}{550}\times100\right)\% \cr
& = \left(\frac{150}{550}\times100\right)\% \cr
& = \frac{300}{11}\% \cr
& = 27.2\% \cr
& \approx 27\% \cr} $$
Answer: Option C. -> 675 tonnes
Average production of company B from 2006 to 2011
$$=\frac{1}{6}\times \left[ \left(\frac{4}{5}\times750\right) + \left(\frac{7}{8}\times800\right) + \left(\frac{4}{3}\times600\right) + \left(\frac{12}{11}\times550\right) + \left(\frac{13}{14}\times700\right) + \left(\frac{14}{13}\times650\right) \right] \text{tonnes}$$
= $$\frac{1}{6}$$ (600 + 700 + 800 + 600 + 650 + 700) tonnes
= $$\frac{4050}{6}$$ tonnes
= 675 tonnes


