Reasoning Aptitude > Data Interpretation
LINE GRAPH MCQs
Line Charts
Total Questions : 135
| Page 6 of 14 pages
Question 51. Two different finance companies declare fixed annual rate of interest on the amounts invested with them by investors. The rate of interest offered by these companies may differ from year to year depending on the variation in the economy of the country and the banks rate of interest. The annual rate of interest offered by the two Companies P and Q over the years are shown by the line graph provided below.
In 2000, a part of Rs. 30 lakhs was invested in Company P and the rest was invested in Company Q for one year. The total interest received was Rs. 2.43 lakhs. What was the amount invested in Company P?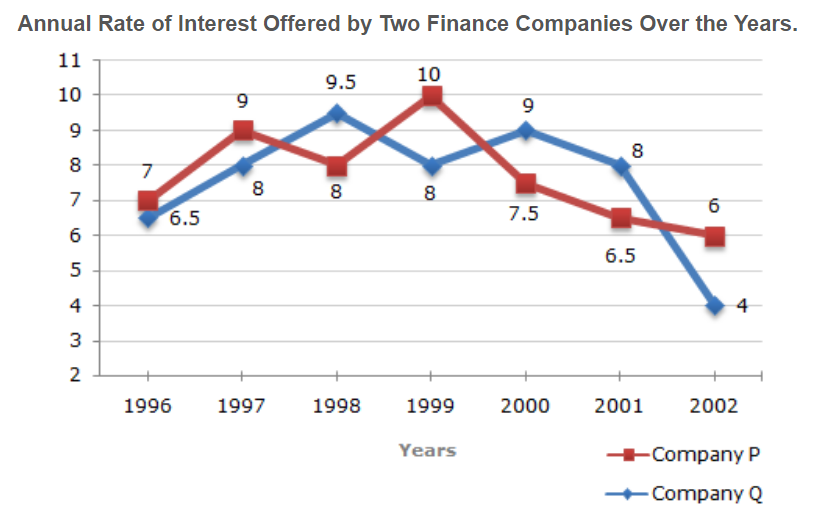
In 2000, a part of Rs. 30 lakhs was invested in Company P and the rest was invested in Company Q for one year. The total interest received was Rs. 2.43 lakhs. What was the amount invested in Company P?

Answer: Option D. -> Rs. 18 lakhs
Answer: (d).Rs. 18 lakhs
Answer: (d).Rs. 18 lakhs
Question 52. Two different finance companies declare fixed annual rate of interest on the amounts invested with them by investors. The rate of interest offered by these companies may differ from year to year depending on the variation in the economy of the country and the banks rate of interest. The annual rate of interest offered by the two Companies P and Q over the years are shown by the line graph provided below.
An investor invested a sum of Rs. 12 lakhs in Company P in 1998. The total amount received after one year was re-invested in the same Company for one more year. The total appreciation received by the investor on his investment was?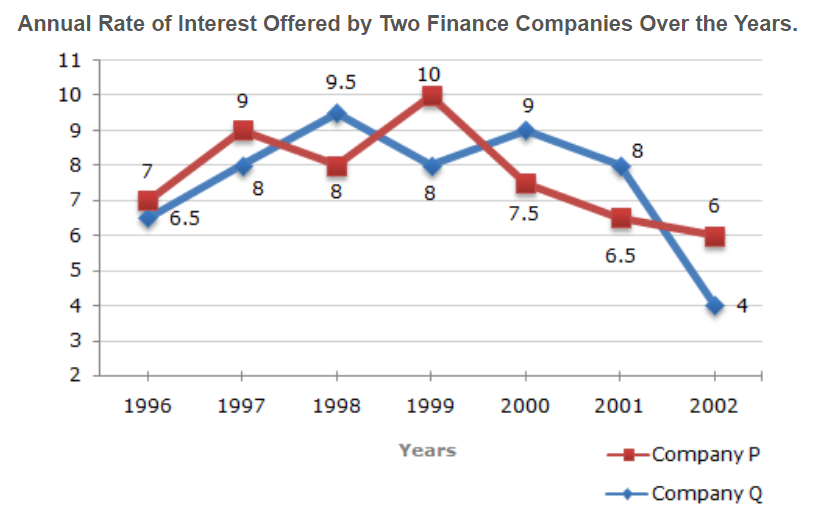
An investor invested a sum of Rs. 12 lakhs in Company P in 1998. The total amount received after one year was re-invested in the same Company for one more year. The total appreciation received by the investor on his investment was?

Answer: Option C. -> Rs. 2,25,600
Answer: (c).Rs. 2,25,600
Answer: (c).Rs. 2,25,600
Question 53. Two different finance companies declare fixed annual rate of interest on the amounts invested with them by investors. The rate of interest offered by these companies may differ from year to year depending on the variation in the economy of the country and the banks rate of interest. The annual rate of interest offered by the two Companies P and Q over the years are shown by the line graph provided below.
An investor invested Rs. 5 lakhs in Company Q in 1996. After one year, the entire amount along with the interest was transferred as investment to Company P in 1997 for one year. What amount will be received from Company P, by the investor?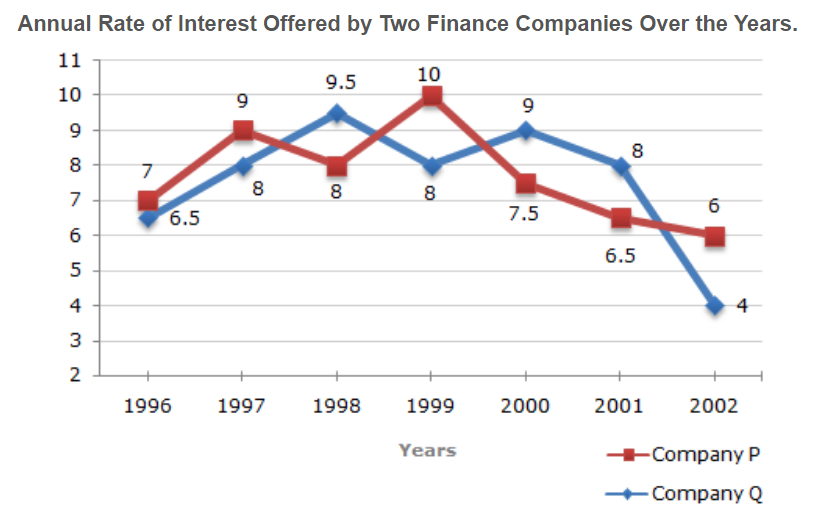
An investor invested Rs. 5 lakhs in Company Q in 1996. After one year, the entire amount along with the interest was transferred as investment to Company P in 1997 for one year. What amount will be received from Company P, by the investor?

Answer: Option B. -> Rs. 5,80,425
Answer: (b).Rs. 5,80,425
Answer: (b).Rs. 5,80,425
Answer: Option A. -> 1997
Answer: (a).1997
Answer: (a).1997
Answer: Option D. -> 3150
Answer: (d).3150
Answer: (d).3150
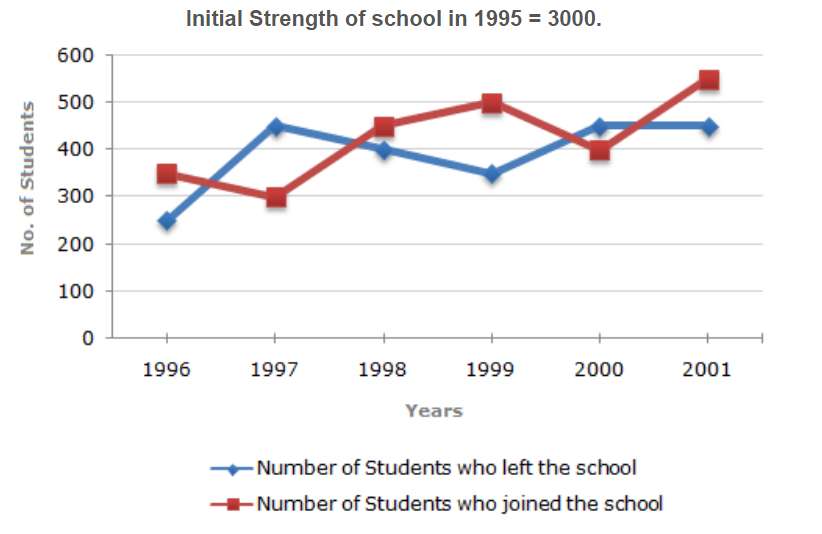
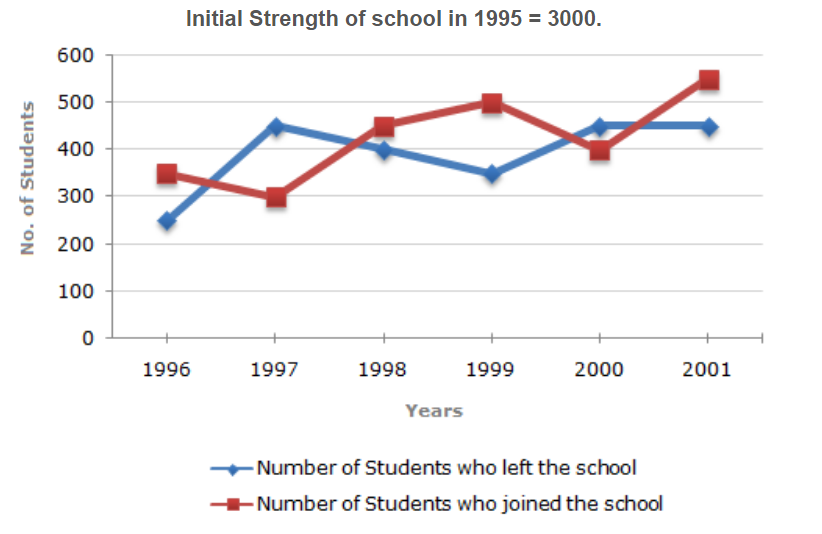
Question 56. Study the following graph carefully and answer the questions given below it :The number of students who joined and left the school in the beginning of year for six years, from 1993 to 1998.Initial strength of the school in 1992 = 1500
During which of the following pairs of years, the strengths of the school is equal?
During which of the following pairs of years, the strengths of the school is equal?
Answer: Option E. -> 1993 and 1995
Strengths of the school in different years 1993 1994 1995 1996 1997 19981550 1450 1550 1700 1600 1650
Question 57. Study the following graph carefully and answer the questions given below it :The number of students who joined and left the school in the beginning of year for six years, from 1993 to 1998.Initial strength of the school in 1992 = 1500
For which of the following years, the percentage rise / fall in number of students left from the previous year is the highest?
For which of the following years, the percentage rise / fall in number of students left from the previous year is the highest?
Answer: Option D. -> 1997
From the graph's inclination, it is clear that the percentage rise / fall is maximum in the year 1997 w.r.t. previous year.
Question 58. Study the following graph carefully and answer the questions given below it :The number of students who joined and left the school in the beginning of year for six years, from 1993 to 1998.Initial strength of the school in 1992 = 1500
How many students were there in the school during the year 1996?
How many students were there in the school during the year 1996?
Answer: Option D. -> 1700
No.of students in 1996 = 1550 + (450 - 300) = 1700
Question 59. Study the following graph carefully and answer the questions given below it :The number of students who joined and left the school in the beginning of year for six years, from 1993 to 1998.Initial strength of the school in 1992 = 1500
The number of students in 1996 is approximately what percent of the number of students in 1994?
The number of students in 1996 is approximately what percent of the number of students in 1994?
Answer: Option B. -> 117
Required percentage = 1700/1450 ≈ 117%
Answer: Option E. -> 20
Turnover of A in 1998 = 400 lakhsTotal turnover of A = 500 + 300 + 450 + 400 + 200 + 275 = 2075 lakhsRequired % = 400/2075 * 100 ≈ 20.

