Question
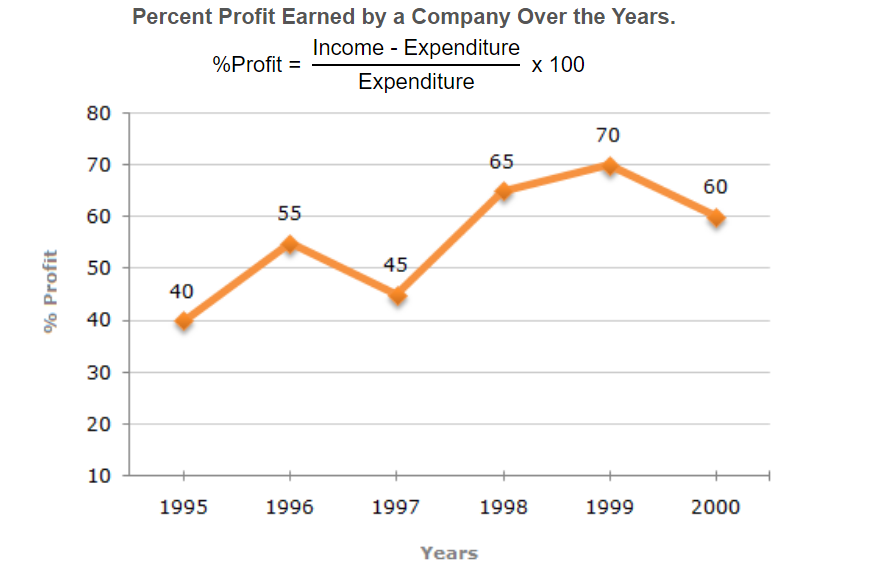
The following line graph gives the annual percent profit earned by a Company during the period 1995 - 2000.
If the expenditures in 1996 and 1999 are equal, then the approximate ratio of the income in 1996 and 1999 respectively is?
If the expenditures in 1996 and 1999 are equal, then the approximate ratio of the income in 1996 and 1999 respectively is?

Answer: Option D
Answer: (d).9:10
Was this answer helpful ?
Answer: (d).9:10
Was this answer helpful ?


Submit Solution