Reasoning Aptitude > Data Interpretation
LINE GRAPH MCQs
Line Charts
Total Questions : 135
| Page 2 of 14 pages
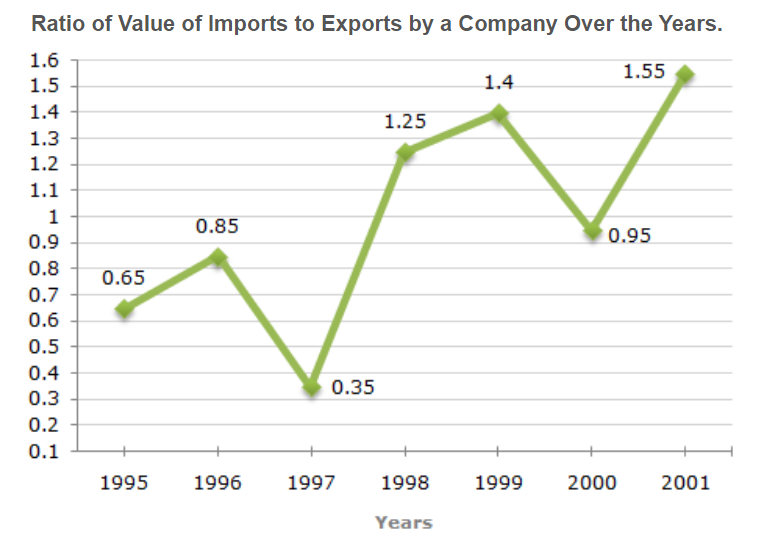
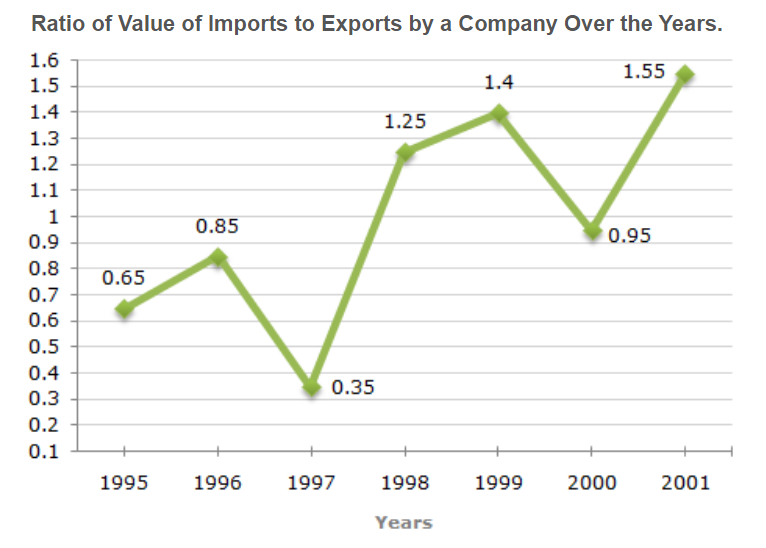
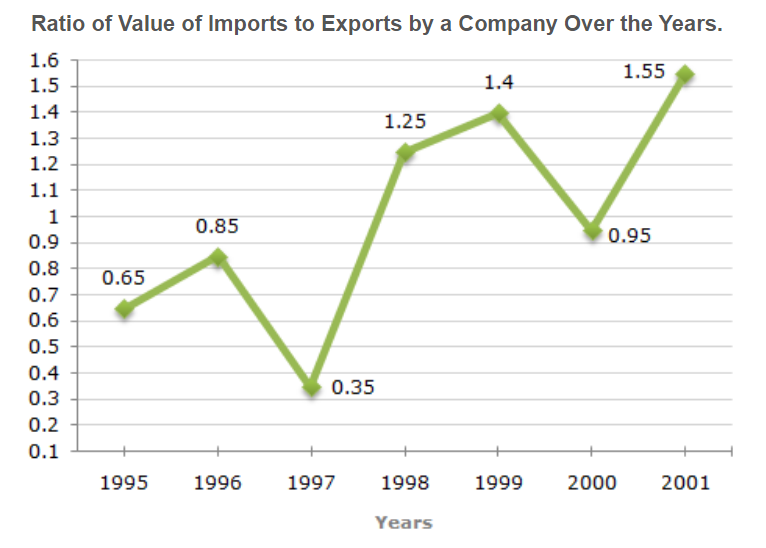
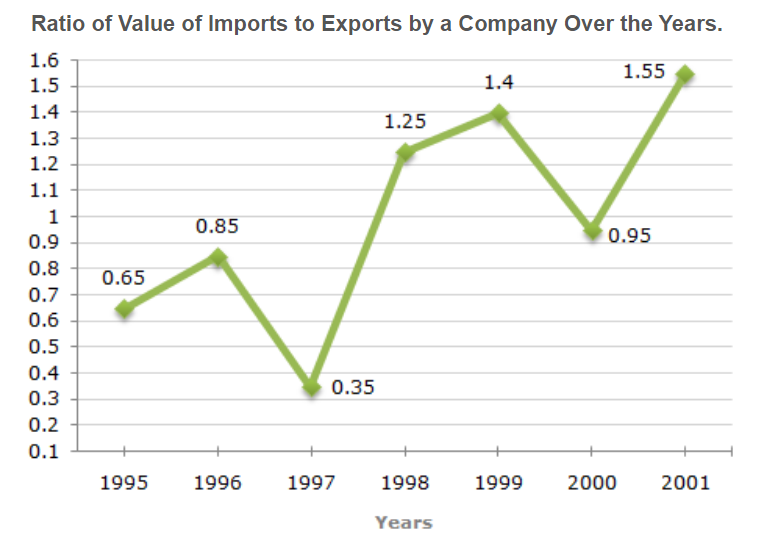
Question 11. The following line graph gives the ratio of the amounts of imports by a company to the amount of exports from that company over the period from 1995 to 2001.
If the imports in 1998 was Rs. 250 crores and the total exports in the years 1998 and 1999 together was Rs. 500 crores, then the imports in 1999 was ?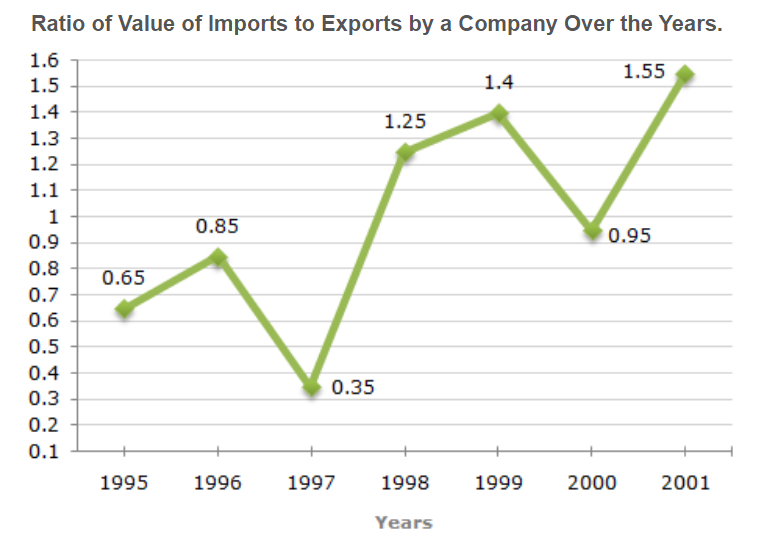
If the imports in 1998 was Rs. 250 crores and the total exports in the years 1998 and 1999 together was Rs. 500 crores, then the imports in 1999 was ?

Answer: Option D. -> Rs. 420 crores
Answer: (d).Rs. 420 crores
Answer: (d).Rs. 420 crores
Answer: Option C. -> 1997
Answer: (c).1997
Answer: (c).1997
Answer: Option D. -> 4
Answer: (d).4
Answer: (d).4
Answer: Option B. -> Rs. 320 crores
Answer: (b).Rs. 320 crores
Answer: (b).Rs. 320 crores
Answer: Option D. -> Data inadequate
Answer: (d).Data inadequate
Answer: (d).Data inadequate
Answer: Option D. -> Rs. 316 crores
Answer: (d).Rs. 316 crores
Answer: (d).Rs. 316 crores
Question 17. Two different finance companies declare fixed annual rate of interest on the amounts invested with them by investors. The rate of interest offered by these companies may differ from year to year depending on the variation in the economy of the country and the banks rate of interest. The annual rate of interest offered by the two Companies P and Q over the years are shown by the line graph provided below.
A sum of Rs. 4.75 lakhs was invested in Company Q in 1999 for one year. How much more interest would have been earned if the sum was invested in Company P?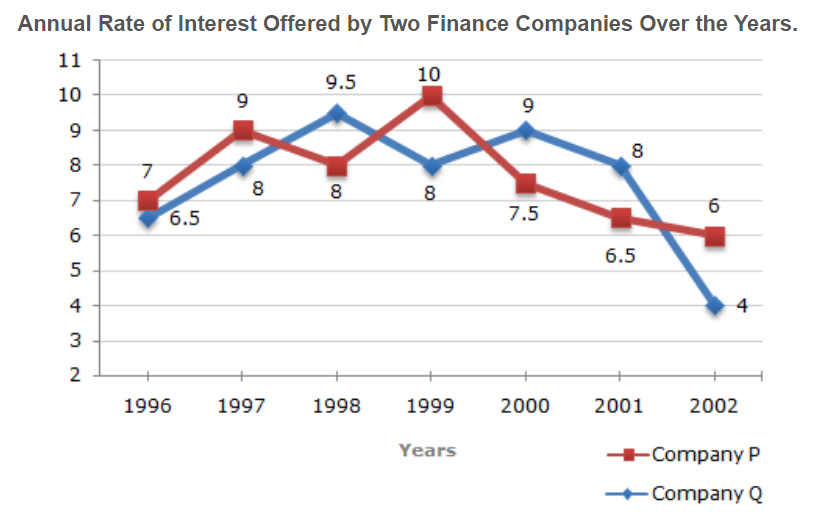
A sum of Rs. 4.75 lakhs was invested in Company Q in 1999 for one year. How much more interest would have been earned if the sum was invested in Company P?

Answer: Option D. -> Rs. 9500
Answer: (d).Rs. 9500
Answer: (d).Rs. 9500
Question 18. Two different finance companies declare fixed annual rate of interest on the amounts invested with them by investors. The rate of interest offered by these companies may differ from year to year depending on the variation in the economy of the country and the banks rate of interest. The annual rate of interest offered by the two Companies P and Q over the years are shown by the line graph provided below.
If two different amounts in the ratio 8:9 are invested in Companies P and Q respectively in 2002, then the amounts received after one year as interests from Companies P and Q are respectively in the ratio?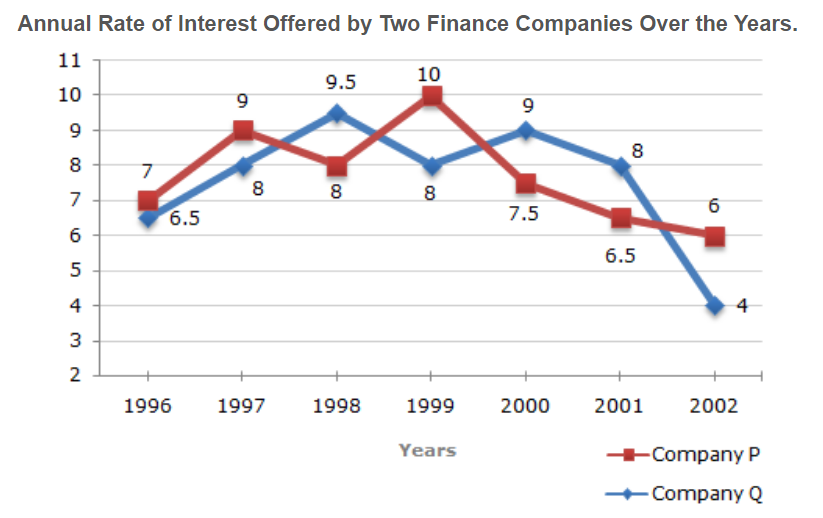
If two different amounts in the ratio 8:9 are invested in Companies P and Q respectively in 2002, then the amounts received after one year as interests from Companies P and Q are respectively in the ratio?

Answer: Option D. -> 4:3
Answer: (d).4:3
Answer: (d).4:3
Answer: Option D. -> Cannot be determined
Answer: (d).Cannot be determined
Answer: (d).Cannot be determined
Answer: Option B. -> Rs. 210 crores
Answer: (b).Rs. 210 crores
Answer: (b).Rs. 210 crores

