Question
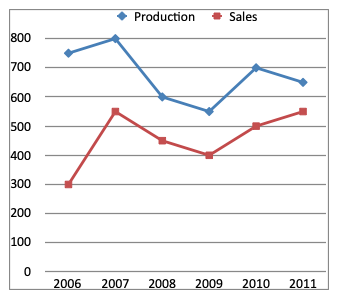
Directions (1 - 5): Study the following graph and answer the questions that follow:
What is the average production of company B (in tonnes) from the year 2006 to the year 2011?

What is the average production of company B (in tonnes) from the year 2006 to the year 2011?
Answer: Option C
Average production of company B from 2006 to 2011
$$=\frac{1}{6}\times \left[ \left(\frac{4}{5}\times750\right) + \left(\frac{7}{8}\times800\right) + \left(\frac{4}{3}\times600\right) + \left(\frac{12}{11}\times550\right) + \left(\frac{13}{14}\times700\right) + \left(\frac{14}{13}\times650\right) \right] \text{tonnes}$$
= $$\frac{1}{6}$$ (600 + 700 + 800 + 600 + 650 + 700) tonnes
= $$\frac{4050}{6}$$ tonnes
= 675 tonnes
Was this answer helpful ?


Submit Solution