Question
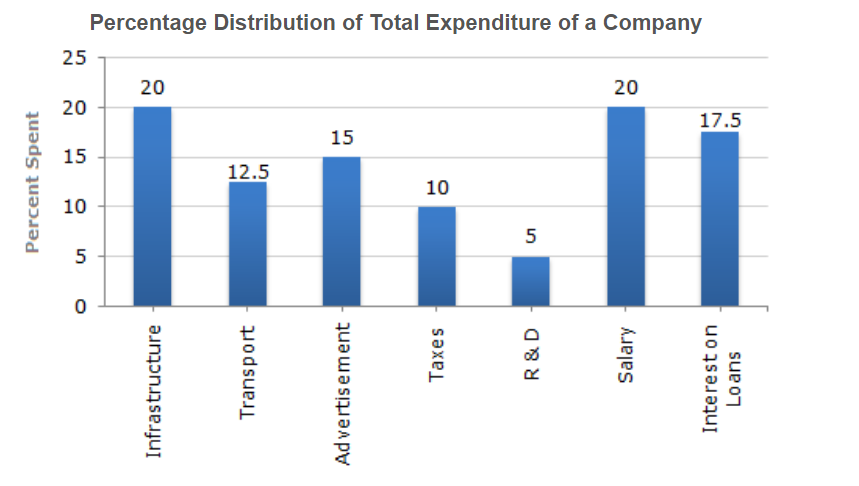
The bar graph given below shows the percentage distribution of the total expenditures of a company under various expense heads during 2003.
What is the ratio of the total expenditure on infrastructure and transport to the total expenditure on taxes and interest on loans?
What is the ratio of the total expenditure on infrastructure and transport to the total expenditure on taxes and interest on loans?

Answer: Option D
Answer: (d).13:11
Was this answer helpful ?
Answer: (d).13:11
Was this answer helpful ?


Submit Solution