Question
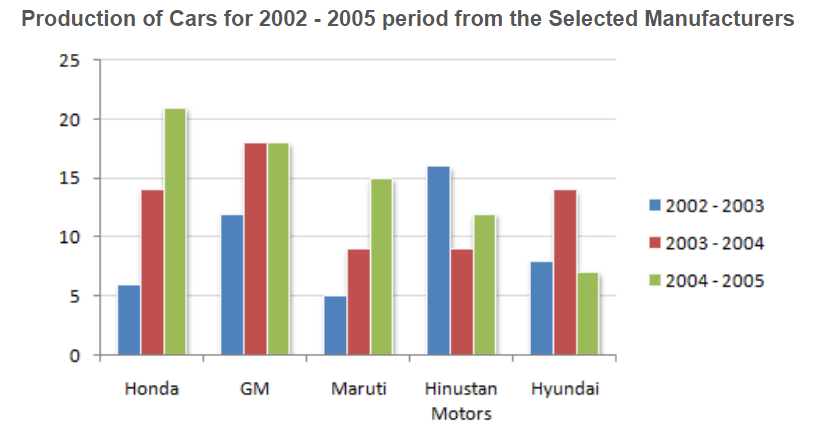
The following chart shows the production of cars in thousands.
How many companies have shown production below their average production in 2002 - 2003, but have showed above the average production in 2003 - 2004 ?
How many companies have shown production below their average production in 2002 - 2003, but have showed above the average production in 2003 - 2004 ?

Answer: Option C
Answer: (c).Three
Was this answer helpful ?
Answer: (c).Three
Was this answer helpful ?


Submit Solution