Question
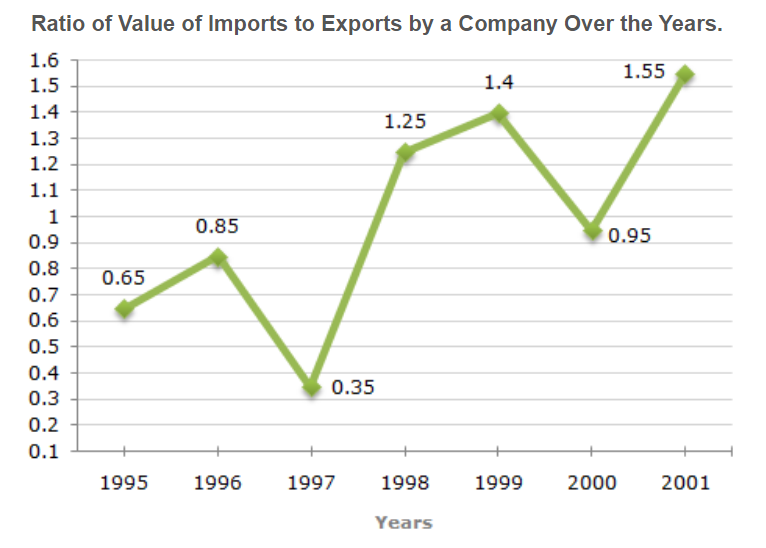
The following line graph gives the ratio of the amounts of imports by a company to the amount of exports from that company over the period from 1995 to 2001.
If the imports of the company in 1996 was Rs. 272 crores, the exports from the company in 1996 was ?
If the imports of the company in 1996 was Rs. 272 crores, the exports from the company in 1996 was ?

Answer: Option B
Answer: (b).Rs. 320 crores
Was this answer helpful ?
Answer: (b).Rs. 320 crores
Was this answer helpful ?


Submit Solution