Reasoning Aptitude > Data Interpretation
PIE CHARTS MCQs
Pie Graphs
Total Questions : 124
| Page 7 of 13 pages
Question 61. Directions (1 - 4): Study the chart and answer the questions:
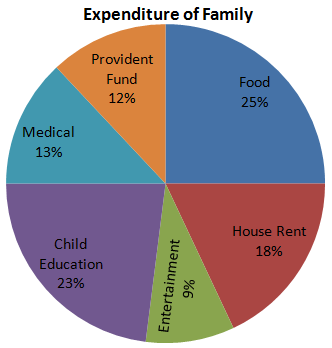
The pie chart given here represents the domestic expenditure of a family in percent. Study the chart and answer the following questions if the total monthly income of the family is Rs. 33,650
The annual savings in the form of provident fund would be:
The pie chart given here represents the domestic expenditure of a family in percent. Study the chart and answer the following questions if the total monthly income of the family is Rs. 33,650

The annual savings in the form of provident fund would be:
Answer: Option A. -> Rs. 48456
Annual provident fund saving
= 12% of (Rs. 33650 × 12)
= $$\frac{12\times33650\times12}{100}$$
= Rs. 48456
Annual provident fund saving
= 12% of (Rs. 33650 × 12)
= $$\frac{12\times33650\times12}{100}$$
= Rs. 48456
Question 62. Directions (1 - 4): Study the chart and answer the questions:
The pie chart given here represents the domestic expenditure of a family in percent. Study the chart and answer the following questions if the total monthly income of the family is Rs. 33,650
The total amount per month, the family spends on food and entertainment combined together, is:
The pie chart given here represents the domestic expenditure of a family in percent. Study the chart and answer the following questions if the total monthly income of the family is Rs. 33,650

The total amount per month, the family spends on food and entertainment combined together, is:
Answer: Option B. -> Rs. 11441
Spent on food and entertainment
= 34% of Rs. 33650
= $$\frac{34\times33650}{100}$$
= Rs. 11441
Spent on food and entertainment
= 34% of Rs. 33650
= $$\frac{34\times33650}{100}$$
= Rs. 11441
Answer: Option B. -> 30%
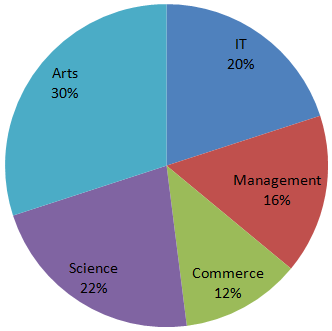
Number of students enrolled in various streams:
$$\eqalign{
& \text{IT → } \frac{20}{100}\times3500 = 700 \cr
& \text{Arts → } \frac{30}{100}\times3500 = 1050 \cr
& \text{Science → } \frac{22}{100}\times3500 = 770 \cr
& \text{Commerce → } \frac{12}{100}\times3500 = 420 \cr
& \text{Management → } \frac{16}{100}\times3500 = 560 \cr} $$
Number of girls enrolled in various streams:
$$\eqalign{
& \text{IT → } \frac{18}{100}\times1500 = 270 \cr
& \text{Arts → } \frac{38}{100}\times1500 = 570 \cr
& \text{Science → } \frac{11}{100}\times1500 = 165 \cr
& \text{Commerce → } \frac{21}{100}\times1500 = 315 \cr
& \text{Management → } \frac{12}{100}\times1500 = 180 \cr} $$
Number of girls enrolled in Arts, Science and Commerce
= 570 + 165 + 315
= 1050
Required percentage
$$\eqalign{
& = \left(\frac{1050}{3500}\times100\right)\% \cr
& = 30\% \cr} $$
Answer: Option C. -> 114 : 121
Number of students enrolled in various streams:
$$\eqalign{
& \text{IT → } \frac{20}{100}\times3500 = 700 \cr
& \text{Arts → } \frac{30}{100}\times3500 = 1050 \cr
& \text{Science → } \frac{22}{100}\times3500 = 770 \cr
& \text{Commerce → } \frac{12}{100}\times3500 = 420 \cr
& \text{Management → } \frac{16}{100}\times3500 = 560 \cr} $$
Number of girls enrolled in various streams:
$$\eqalign{
& \text{IT → } \frac{18}{100}\times1500 = 270 \cr
& \text{Arts → } \frac{38}{100}\times1500 = 570 \cr
& \text{Science → } \frac{11}{100}\times1500 = 165 \cr
& \text{Commerce → } \frac{21}{100}\times1500 = 315 \cr
& \text{Management → } \frac{12}{100}\times1500 = 180 \cr} $$
(Number of girls enrolled in Arts) : (Number of boys enrolled in Science)
= 570 : (770 - 165)
= 570 : 605
= 114 : 121
Answer: Option B. -> 810
Number of students enrolled in various streams:
$$\eqalign{
& \text{IT → } \frac{20}{100}\times3500 = 700 \cr
& \text{Arts → } \frac{30}{100}\times3500 = 1050 \cr
& \text{Science → } \frac{22}{100}\times3500 = 770 \cr
& \text{Commerce → } \frac{12}{100}\times3500 = 420 \cr
& \text{Management → } \frac{16}{100}\times3500 = 560 \cr} $$
Number of girls enrolled in various streams:
$$\eqalign{
& \text{IT → } \frac{18}{100}\times1500 = 270 \cr
& \text{Arts → } \frac{38}{100}\times1500 = 570 \cr
& \text{Science → } \frac{11}{100}\times1500 = 165 \cr
& \text{Commerce → } \frac{21}{100}\times1500 = 315 \cr
& \text{Management → } \frac{12}{100}\times1500 = 180 \cr} $$
Total number of boys enrolled in Management and IT together
= (560 - 180) + (700 - 270)
= 380 + 430
= 810
Answer: Option A. -> 593
Number of students enrolled in various streams:
$$\eqalign{
& \text{IT → } \frac{20}{100}\times3500 = 700 \cr
& \text{Arts → } \frac{30}{100}\times3500 = 1050 \cr
& \text{Science → } \frac{22}{100}\times3500 = 770 \cr
& \text{Commerce → } \frac{12}{100}\times3500 = 420 \cr
& \text{Management → } \frac{16}{100}\times3500 = 560 \cr} $$
Number of girls enrolled in various streams:
$$\eqalign{
& \text{IT → } \frac{18}{100}\times1500 = 270 \cr
& \text{Arts → } \frac{38}{100}\times1500 = 570 \cr
& \text{Science → } \frac{11}{100}\times1500 = 165 \cr
& \text{Commerce → } \frac{21}{100}\times1500 = 315 \cr
& \text{Management → } \frac{12}{100}\times1500 = 180 \cr} $$
Number of Management students already enrolled = 560
New required number
$$\eqalign{
& = 560 + \left(\frac{20}{100}\times165\right) \cr
& = 560+33 \cr
& = 593 \cr} $$
Answer: Option D. -> 480
Number of students enrolled in various streams:
$$\eqalign{
& \text{IT → } \frac{20}{100}\times3500 = 700 \cr
& \text{Arts → } \frac{30}{100}\times3500 = 1050 \cr
& \text{Science → } \frac{22}{100}\times3500 = 770 \cr
& \text{Commerce → } \frac{12}{100}\times3500 = 420 \cr
& \text{Management → } \frac{16}{100}\times3500 = 560 \cr} $$
Number of girls enrolled in various streams:
$$\eqalign{
& \text{IT → } \frac{18}{100}\times1500 = 270 \cr
& \text{Arts → } \frac{38}{100}\times1500 = 570 \cr
& \text{Science → } \frac{11}{100}\times1500 = 165 \cr
& \text{Commerce → } \frac{21}{100}\times1500 = 315 \cr
& \text{Management → } \frac{12}{100}\times1500 = 180 \cr} $$
Total number of girls enrolled in Science and Commerce together
= 165 + 315
= 480
Answer: Option C. -> Rs. 3500, Rs. 2250
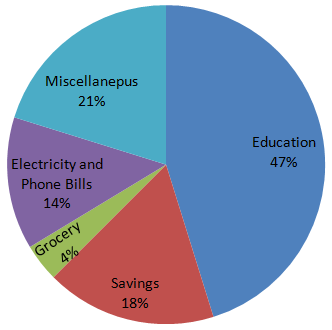
$$\eqalign{
& \text{Expenditure on grocery} \cr
& = \frac{25000 \times 14}{100} \cr
& = \text{Rs. } 3500 \cr
& \text{Expenditure on electricity} \cr
& = \frac{25000 \times 9}{100} \cr
& = \text{Rs. } 2250 \cr } $$
$$\eqalign{
& \text{Expenditure on grocery} \cr
& = \frac{25000 \times 14}{100} \cr
& = \text{Rs. } 3500 \cr
& \text{Expenditure on electricity} \cr
& = \frac{25000 \times 9}{100} \cr
& = \text{Rs. } 2250 \cr } $$
Answer: Option D. -> 10.82%
$$\eqalign{
& \text{Expenditure on education in April} \cr
& = 24000 \times \frac{47}{100} \cr
& = \text{Rs. }11280 \cr
& \text{Expenditure on education in May} \cr
& = 25000 \times \frac{50}{100} \cr
& = \text{Rs. }12500 \cr
& \text{Percentage increase} \cr
& = \frac{12500 - 11280}{11280} \times 100 \cr
& = 10.82\% \cr }$$
Answer: Option A. -> 216 : 25
Required ratio
= $$\frac{24000 \times 18}{100}$$ : $$\frac{25000 \times 2}{100}$$
= 24 ×18 : 25 × 2
= 216 : 25
Required ratio
= $$\frac{24000 \times 18}{100}$$ : $$\frac{25000 \times 2}{100}$$
= 24 ×18 : 25 × 2
= 216 : 25


