Reasoning Aptitude > Data Interpretation
PIE CHARTS MCQs
Pie Graphs
Total Questions : 124
| Page 6 of 13 pages
Question 51. Analyse the pie charts and answer the following question.
Over the period 2005-2006, if sales (value-wise) of IBM PC's increased by 50% and of Apple by 15% assuming that PC sales of all other computer companies remained the same, by what percentage (approximately) would the PC sales in New York (value-wise) increase over the same period ?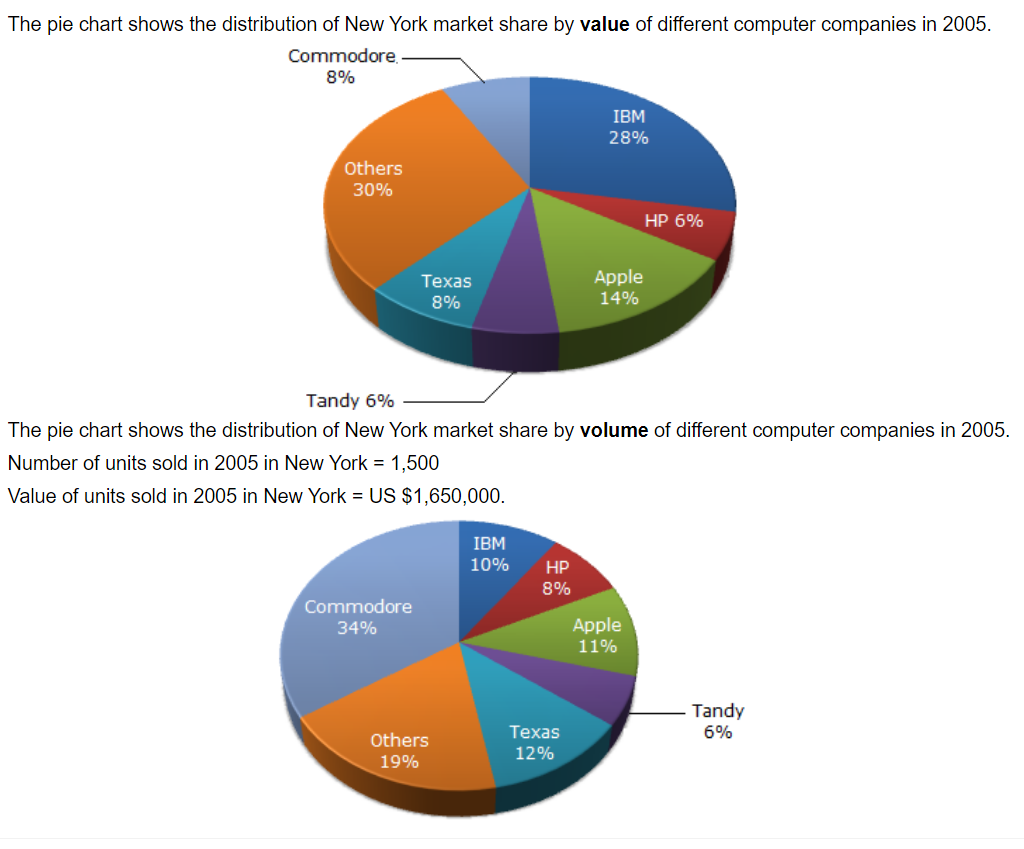
Over the period 2005-2006, if sales (value-wise) of IBM PC's increased by 50% and of Apple by 15% assuming that PC sales of all other computer companies remained the same, by what percentage (approximately) would the PC sales in New York (value-wise) increase over the same period ?

Answer: Option A. -> 16.1 %
Answer: (a).16.1 %
Answer: (a).16.1 %
Answer: Option B. -> External Assistance
Answer: (b).External Assistance
Answer: (b).External Assistance
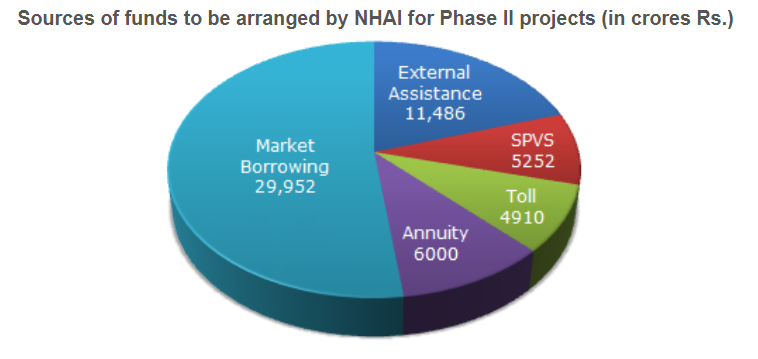
Question 53. The following pie-chart shows the sources of funds to be collected by the National Highways Authority of India (NHAI) for its Phase II projects. Study the pie-chart and answers the following question.
If NHAI could receive a total of Rs. 9695 crores as External Assistance, by what percent (approximately) should it increase the Market Borrowing to arrange for the shortage of funds?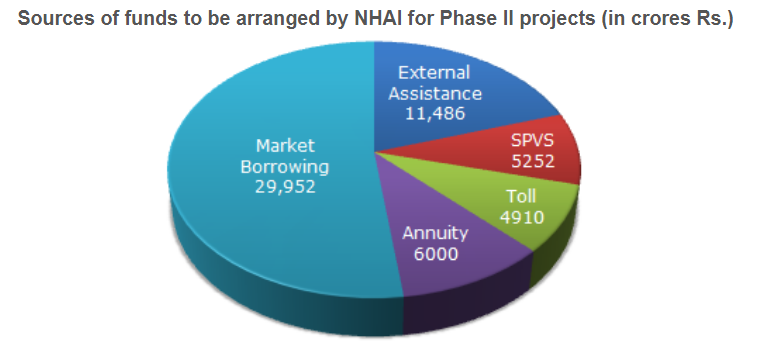
If NHAI could receive a total of Rs. 9695 crores as External Assistance, by what percent (approximately) should it increase the Market Borrowing to arrange for the shortage of funds?

Answer: Option C. -> 6%
Answer: (c).6%
Answer: (c).6%
Answer: Option C. -> 22000
Answer: (c).22000
Answer: (c).22000
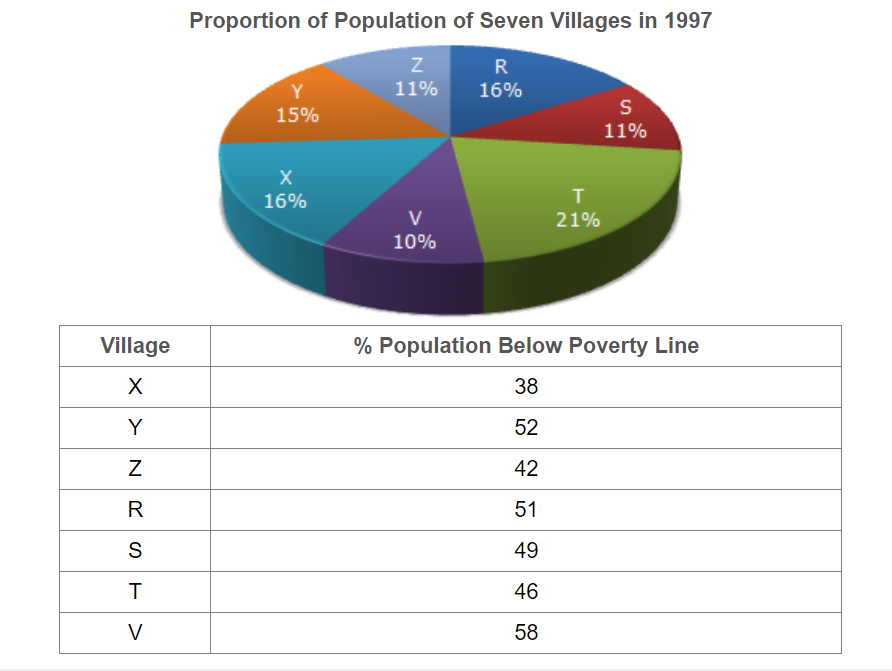
Question 55. Study the following pie-chart and the table and answer the following question based on them.
If in 1998, the population of villages Y and V increase by 10% each and the percentage of population below poverty line remains unchanged for all the villages, then find the population of village V below poverty line in 1998, given that the population of village Y in 1997 was 30000.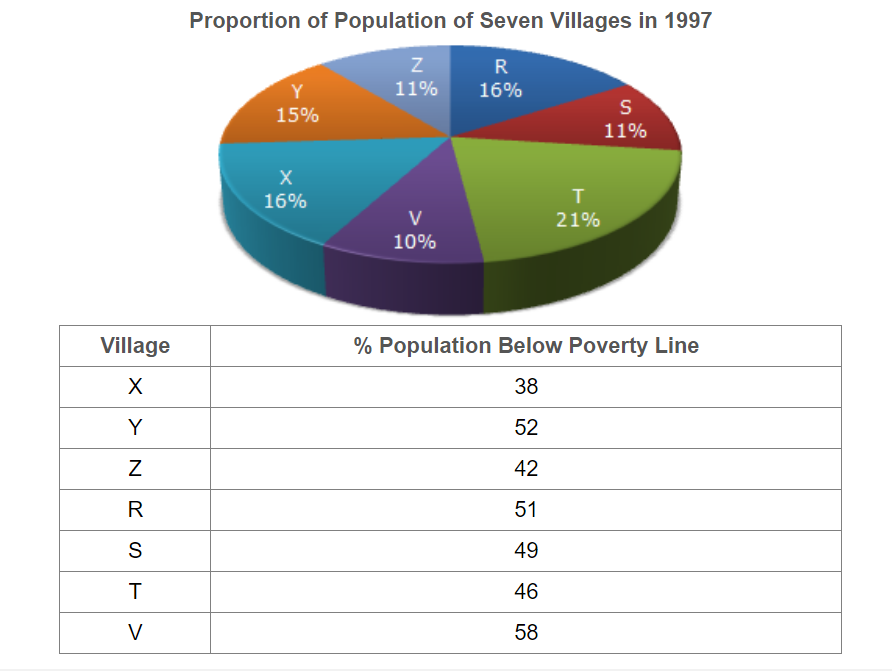
If in 1998, the population of villages Y and V increase by 10% each and the percentage of population below poverty line remains unchanged for all the villages, then find the population of village V below poverty line in 1998, given that the population of village Y in 1997 was 30000.

Answer: Option B. -> 12760
Answer: (b).12760
Answer: (b).12760
Answer: Option C. -> 122
Answer: (c).122
Answer: (c).122
Answer: Option C. -> 44 %
Answer: (c).44 %
Answer: (c).44 %
Answer: Option B. -> 24,363 crore
Answer: (b).24,363 crore
Answer: (b).24,363 crore
Answer: Option C. -> Rs. 6057
House rent per month
= 18% of Rs. 33650
= Rs. $$\frac{18\times33650}{100}$$
= Rs. 6057
House rent per month
= 18% of Rs. 33650
= Rs. $$\frac{18\times33650}{100}$$
= Rs. 6057
Question 60. Directions (1 - 4): Study the chart and answer the questions:
The pie chart given here represents the domestic expenditure of a family in percent. Study the chart and answer the following questions if the total monthly income of the family is Rs. 33,650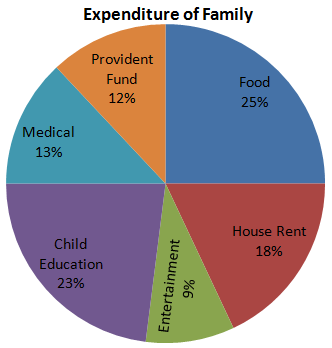
After providential fund deductions and payment of house rent, the total monthly income of the family remains:
The pie chart given here represents the domestic expenditure of a family in percent. Study the chart and answer the following questions if the total monthly income of the family is Rs. 33,650

After providential fund deductions and payment of house rent, the total monthly income of the family remains:
Answer: Option C. -> Rs. 23555
Remaining income
= (100 - 12 - 18)% of Rs. 33650
= Rs. $$\frac{70\times33650}{100}$$
= Rs. 23555
Remaining income
= (100 - 12 - 18)% of Rs. 33650
= Rs. $$\frac{70\times33650}{100}$$
= Rs. 23555

