Sail E0 Webinar

Reasoning Aptitude > Data Interpretation

PIE CHARTS MCQs

Pie Graphs

Total Questions : 124 | Page 2 of 13 pages
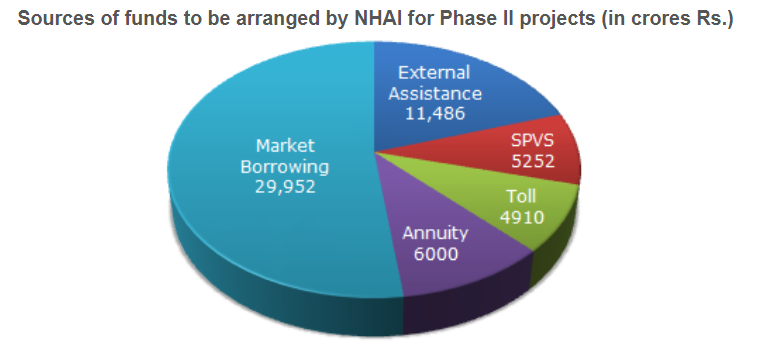
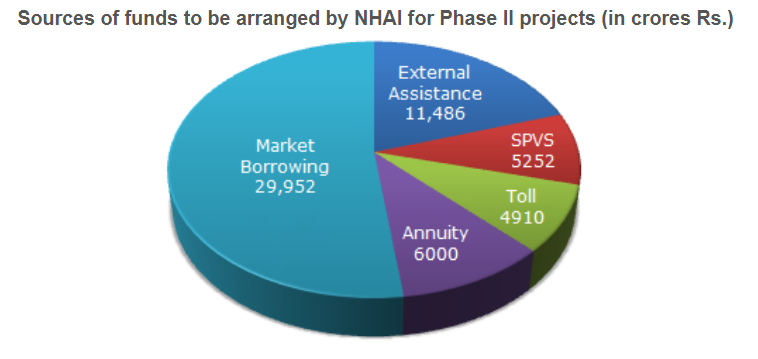
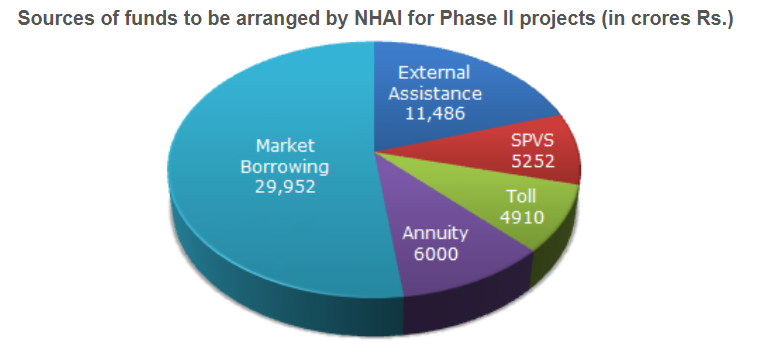
Question 11. The following pie-chart shows the sources of funds to be collected by the National Highways Authority of India (NHAI) for its Phase II projects. Study the pie-chart and answers the following question.
If the toll is to be collected through an outsourced agency by allowing a maximum 10% commission, how much amount should be permitted to be collected by the outsourced agency, so that the project is supported with Rs. 4910 crores?The Following Pie-chart Shows The Sources Of Funds To Be Col...
  1.    Rs. 6213 crores
  2.    Rs. 5827 crores
  3.    Rs. 5401 crores
  4.    Rs. 5316 crores
 Discuss Question
Answer: Option C. -> Rs. 5401 crores
Answer: (c).Rs. 5401 crores
Question 12. The following pie-chart shows the sources of funds to be collected by the National Highways Authority of India (NHAI) for its Phase II projects. Study the pie-chart and answers the following question.
The central angle corresponding to Market Borrowing isThe Following Pie-chart Shows The Sources Of Funds To Be Col...
  1.    52°
  2.    137.8°
  3.    187.2°
  4.    192.4°
 Discuss Question
Answer: Option C. -> 187.2°
Answer: (c).187.2°
Question 13. The following pie-chart shows the sources of funds to be collected by the National Highways Authority of India (NHAI) for its Phase II projects. Study the pie-chart and answers the following question.
The approximate ratio of the funds to be arranged through Toll and that through Market Borrowing isThe Following Pie-chart Shows The Sources Of Funds To Be Col...
  1.    2 : 9
  2.    1 : 6
  3.    3 : 11
  4.    2 : 5
 Discuss Question
Answer: Option B. -> 1 : 6
Answer: (b).1 : 6
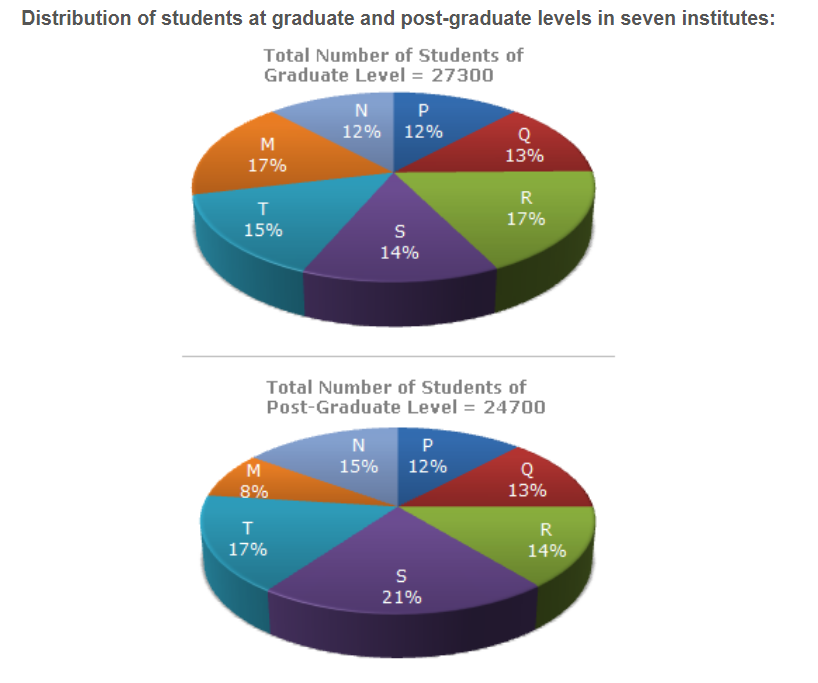
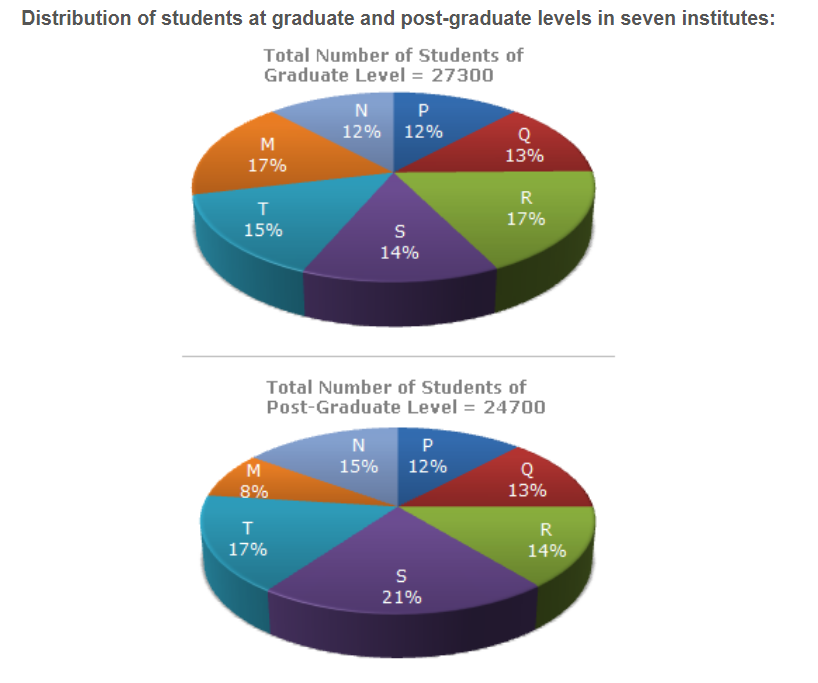
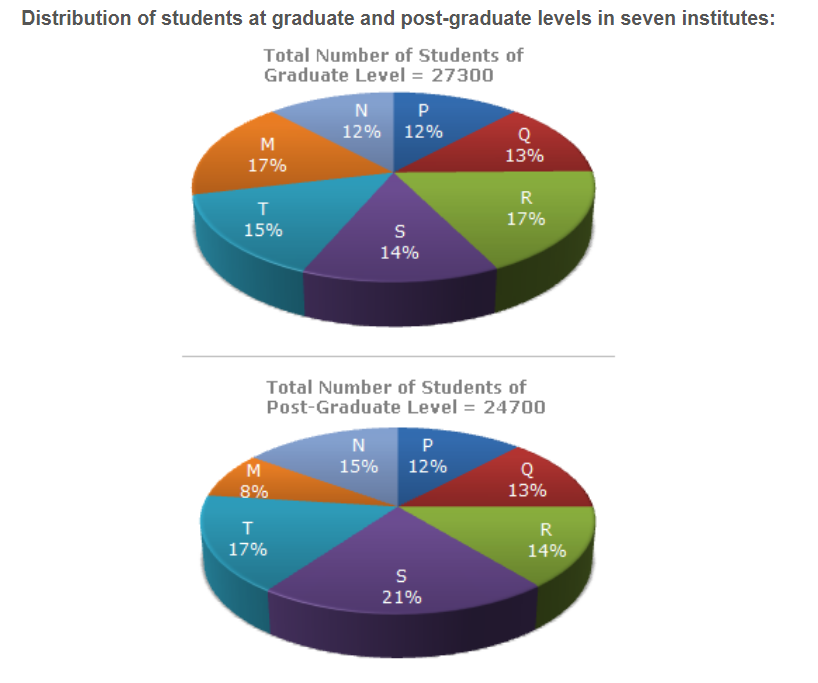
Question 14. The following pie-charts show the distribution of students of graduate and post-graduate levels in seven different institutes in a town.
What is the ratio between the number of students studying at post-graduate and graduate levels respectively from institute S?The Following Pie-charts Show The Distribution Of Students O...
  1.    14 : 19
  2.    19 : 21
  3.    17 : 21
  4.    19 : 14
 Discuss Question
Answer: Option D. -> 19 : 14
Answer: (d).19 : 14
Question 15. The following pie-charts show the distribution of students of graduate and post-graduate levels in seven different institutes in a town.
What is the total number of graduate and post-graduate level students is institute R?The Following Pie-charts Show The Distribution Of Students O...
  1.    8320
  2.    7916
  3.    9116
  4.    8099
 Discuss Question
Answer: Option D. -> 8099
Answer: (d).8099
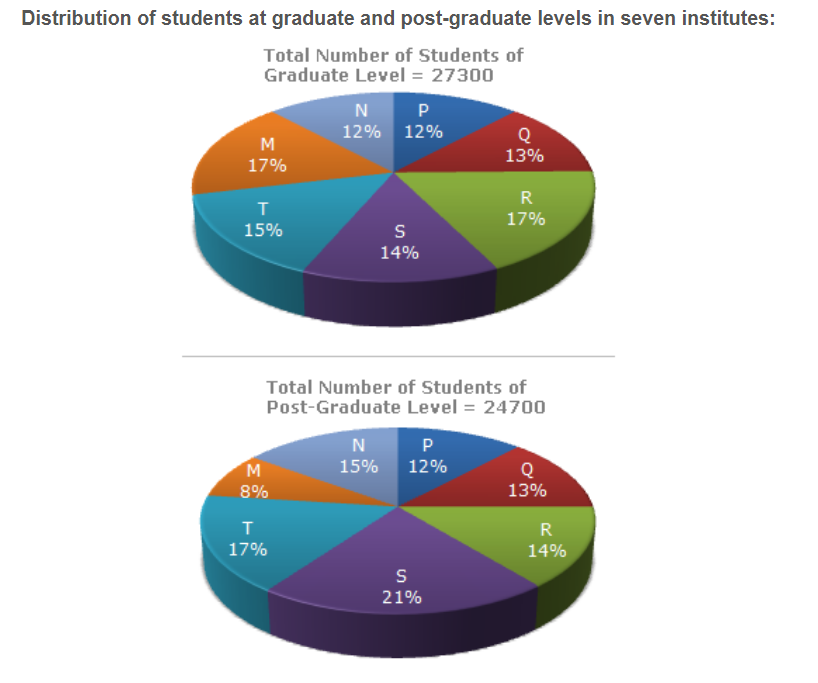
Question 16. The following pie-charts show the distribution of students of graduate and post-graduate levels in seven different institutes in a town.
How many students of institutes of M and S are studying at graduate level?The Following Pie-charts Show The Distribution Of Students O...
  1.    7516
  2.    8463
  3.    9127
  4.    9404
 Discuss Question
Answer: Option B. -> 8463
Answer: (b).8463
Question 17. The following pie-charts show the distribution of students of graduate and post-graduate levels in seven different institutes in a town.
Total number of students studying at post-graduate level from institutes N and P isThe Following Pie-charts Show The Distribution Of Students O...
  1.    5601
  2.    5944
  3.    6669
  4.    8372
 Discuss Question
Answer: Option C. -> 6669
Answer: (c).6669
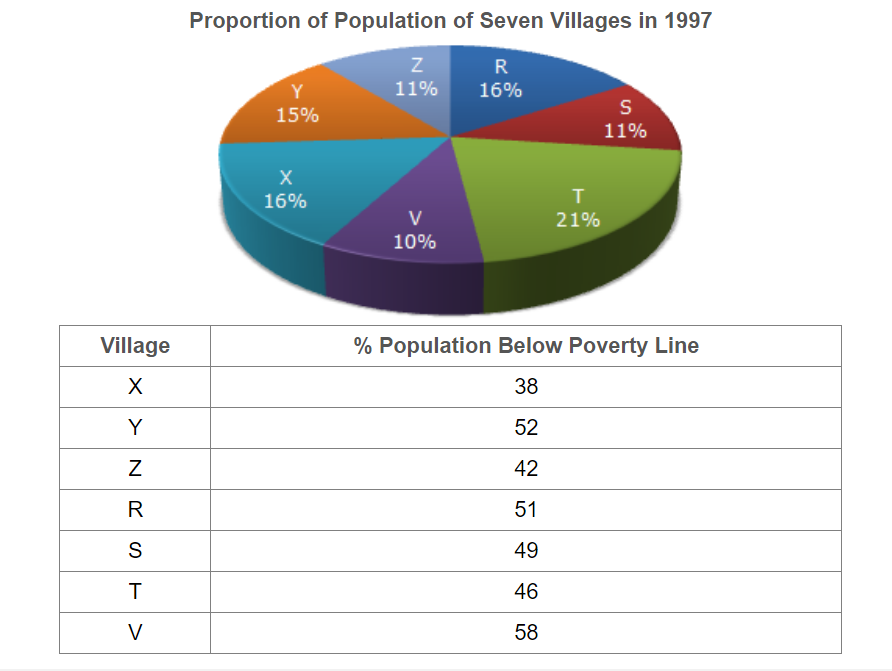
Question 18. Study the following pie-chart and the table and answer the following question based on them.
The ratio of population of village T below poverty line to that of village Z below poverty line in 1997 is:Study The Following Pie-chart And The Table And Answer The F...
  1.    11 : 23
  2.    13 : 11
  3.    23 : 11
  4.    11 : 13
 Discuss Question
Answer: Option C. -> 23 : 11
Answer: (c).23 : 11
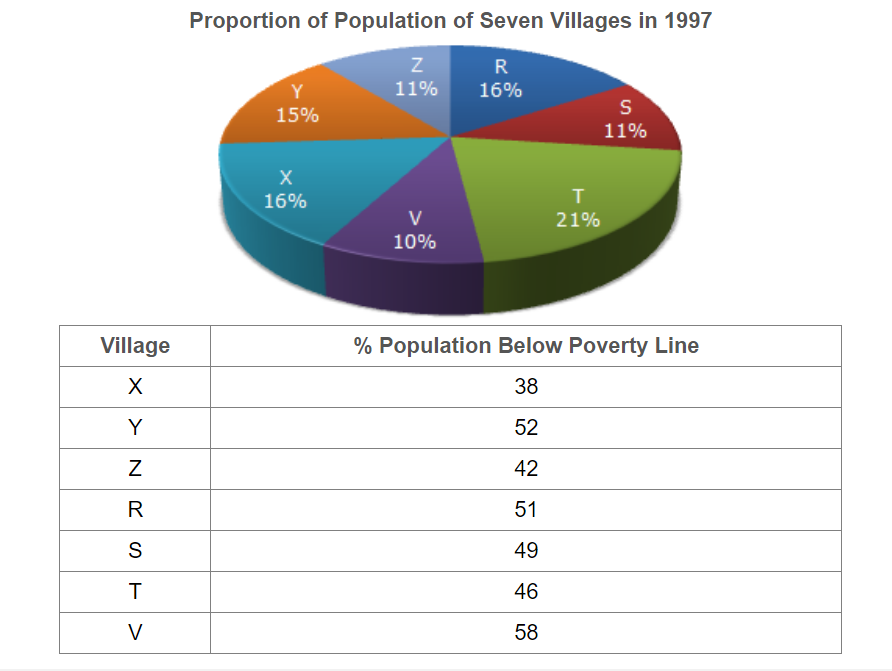
Question 19. Study the following pie-chart and the table and answer the following question based on them.
If the population of village R in 1997 is 32000, then what will be the population of village Y below poverty line in that year?Study The Following Pie-chart And The Table And Answer The F...
  1.    14100
  2.    15600
  3.    16500
  4.    17000
 Discuss Question
Answer: Option B. -> 15600
Answer: (b).15600
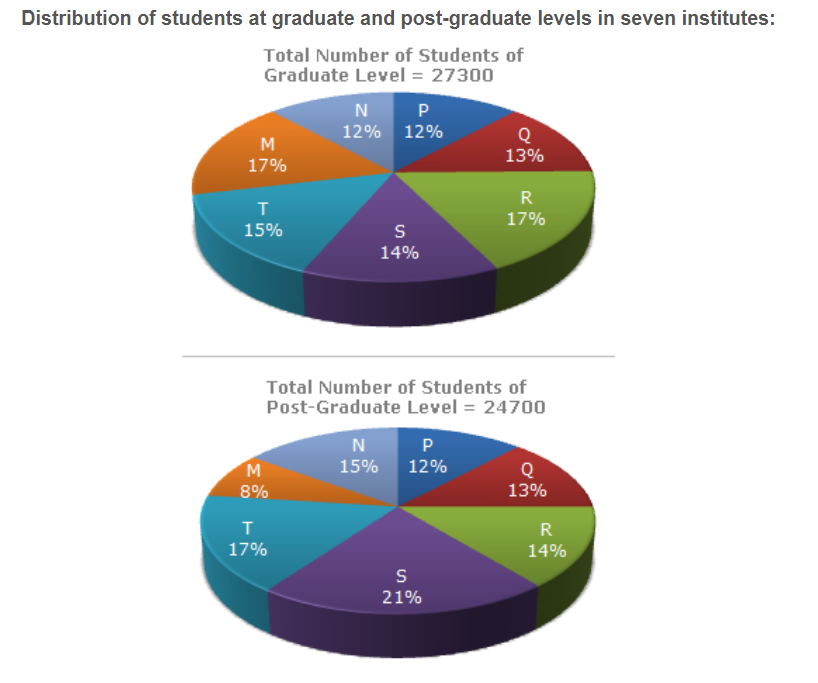
Question 20. The following pie-charts show the distribution of students of graduate and post-graduate levels in seven different institutes in a town.
What is the ratio between the number of students studying at post-graduate level from institutes S and the number of students studying at graduate level from institute Q?The Following Pie-charts Show The Distribution Of Students O...
  1.    13 : 19
  2.    21 : 13
  3.    13 : 8
  4.    19 : 13
 Discuss Question
Answer: Option D. -> 19 : 13
Answer: (d).19 : 13

Latest Videos

Latest Test Papers