Sail E0 Webinar

Reasoning Aptitude > Data Interpretation

PIE CHARTS MCQs

Pie Graphs

Total Questions : 124 | Page 5 of 13 pages
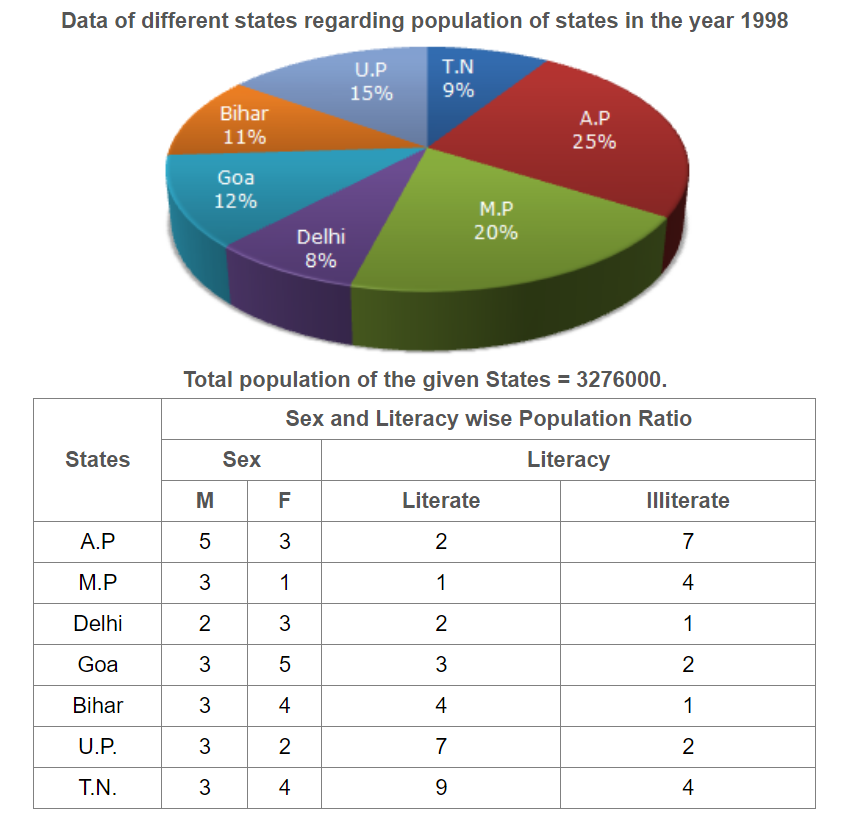
Question 41. Study the following graph and the table and answer the question given below.
What is the ratio of the number of females in T.N. to the number of females in Delhi?Study The Following Graph And The Table And Answer The Quest...
  1.    7 : 5
  2.    9 : 7
  3.    13 : 11
  4.    15 : 14
 Discuss Question
Answer: Option D. -> 15 : 14
Answer: (d).15 : 14
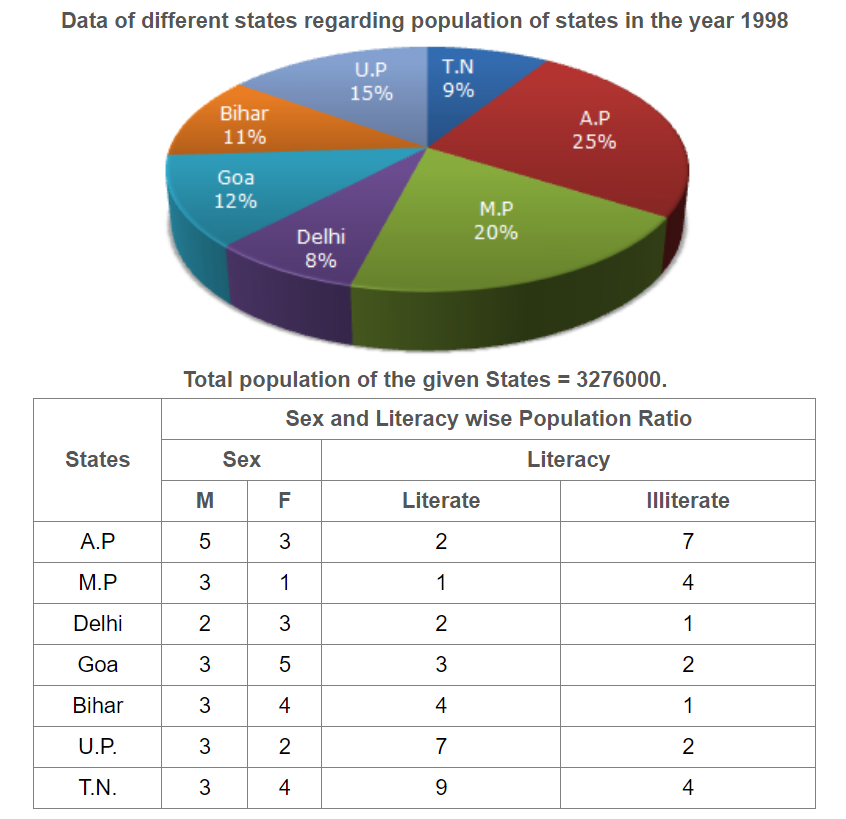
Question 42. Study the following graph and the table and answer the question given below.
What was the number of males in U.P. in the year 1998?Study The Following Graph And The Table And Answer The Quest...
  1.    254650
  2.    294840
  3.    321470
  4.    341200
 Discuss Question
Answer: Option B. -> 294840
Answer: (b).294840
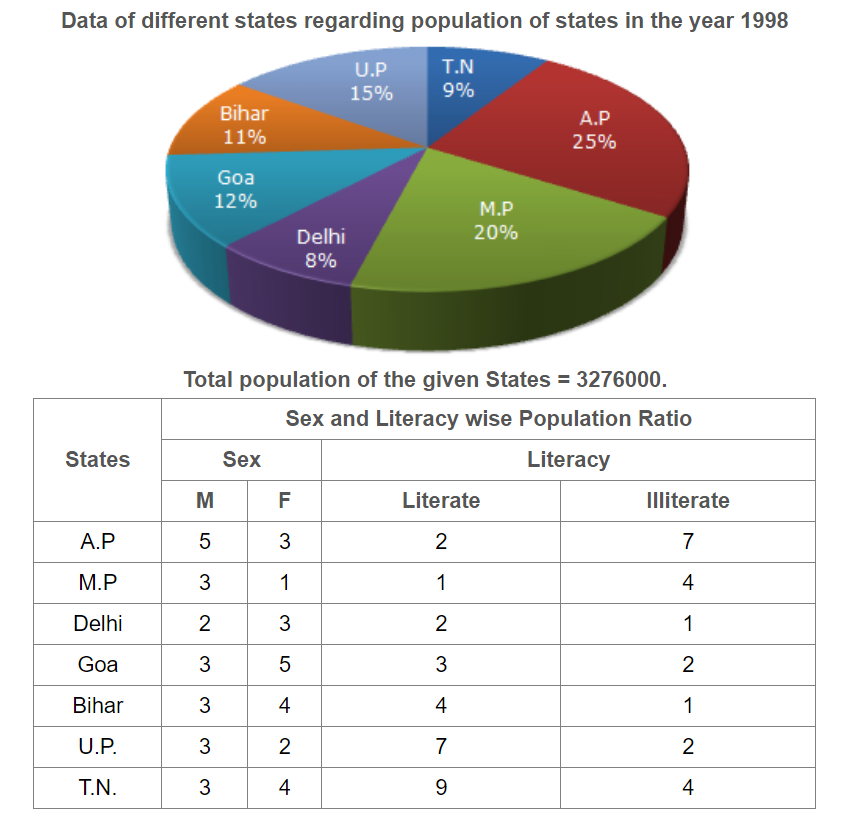
Question 43. Study the following graph and the table and answer the question given below.
If in the year 1998, there was an increase of 10% in the population of U.P. and 12% in the population of M.P. compared to the previous year, then what was the ratio of populations of U.P. and M.P. in 1997?Study The Following Graph And The Table And Answer The Quest...
  1.    42 : 55
  2.    48 : 55
  3.    7 : 11
  4.    4 : 5
 Discuss Question
Answer: Option A. -> 42 : 55
Answer: (a).42 : 55
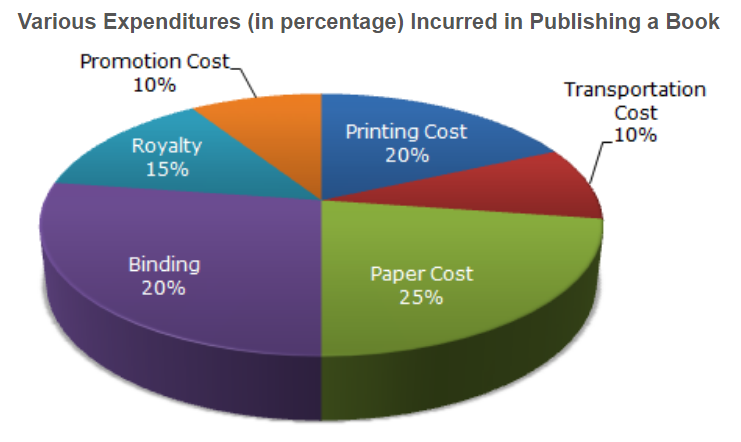
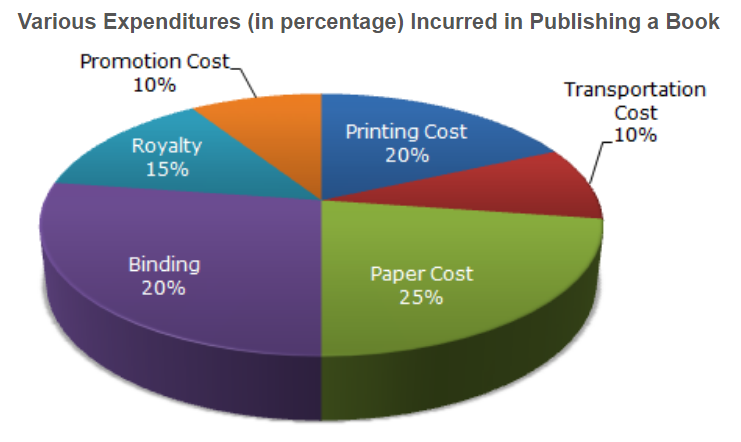
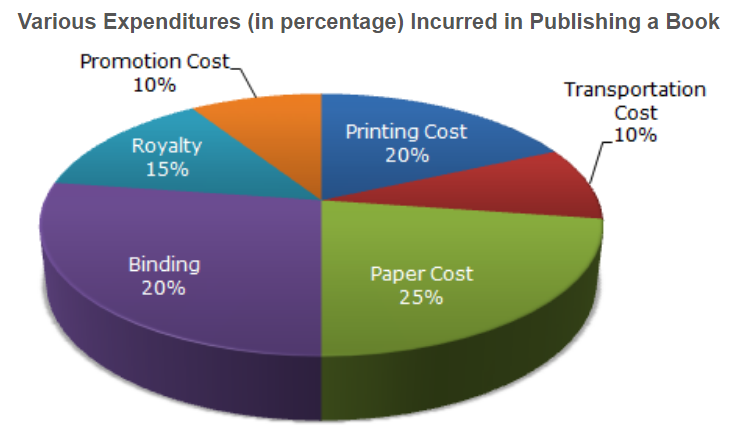
Question 44. The following pie-chart shows the percentage distribution of the expenditure incurred in publishing a book. Study the pie-chart and the answer the question based on it.
If the difference between the two expenditures are represented by 18° in the pie-chart, then these expenditures possibly areThe Following Pie-chart Shows The Percentage Distribution Of...
  1.    Binding Cost and Promotion Cost
  2.    Paper Cost and Royalty
  3.    Binding Cost and Printing Cost
  4.    Paper Cost and Printing Cost
 Discuss Question
Answer: Option D. -> Paper Cost and Printing Cost
Answer: (d).Paper Cost and Printing Cost
Question 45. The following pie-chart shows the percentage distribution of the expenditure incurred in publishing a book. Study the pie-chart and the answer the question based on it.
If for an edition of the book, the cost of paper is Rs. 56250, then find the promotion cost for this edition.The Following Pie-chart Shows The Percentage Distribution Of...
  1.    Rs. 20,000
  2.    Rs. 22,500
  3.    Rs. 25,500
  4.    Rs. 28,125
 Discuss Question
Answer: Option B. -> Rs. 22,500
Answer: (b).Rs. 22,500
Question 46. The following pie-chart shows the percentage distribution of the expenditure incurred in publishing a book. Study the pie-chart and the answer the question based on it.
Which two expenditures together have central angle of 108°?The Following Pie-chart Shows The Percentage Distribution Of...
  1.    Biding Cost and Transportation Cost
  2.    Printing Cost and Paper Cost
  3.    Royalty and Promotion Cost
  4.    Binding Cost and Paper Cost
 Discuss Question
Answer: Option A. -> Biding Cost and Transportation Cost
Answer: (a).Biding Cost and Transportation Cost
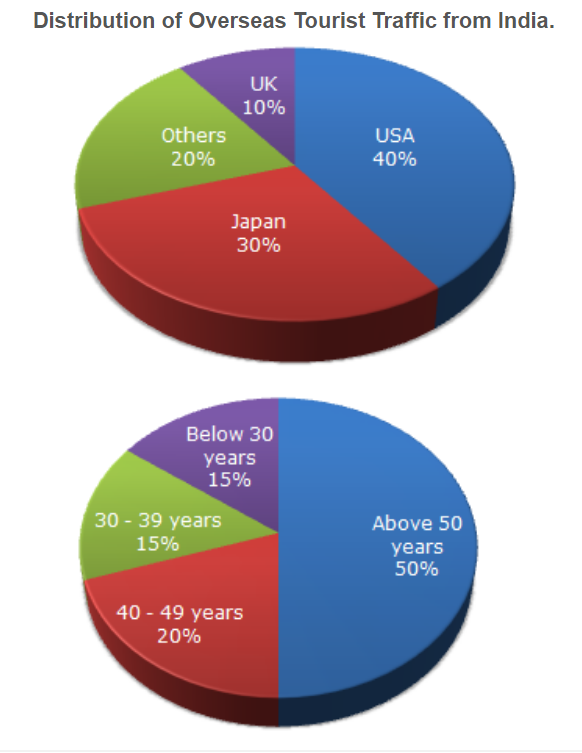
Question 47. The following pie charts exhibit the distribution of the overseas tourist traffic from India. The two charts shows the tourist distribution by country and the age profiles of the tourists respectively.
What percentage of Indian tourist went to either USA or UK ?The Following Pie Charts Exhibit The Distribution Of The Ove...
  1.    40 %
  2.    50 %
  3.    60 %
  4.    70 %
 Discuss Question
Answer: Option B. -> 50 %
Answer: (b).50 %
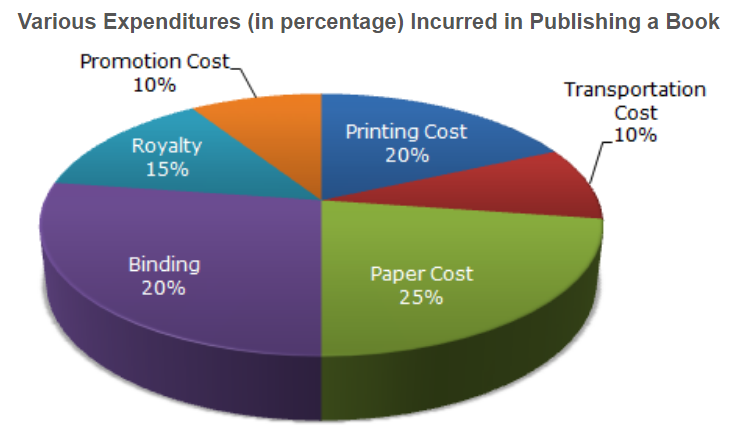
Question 48. The following pie-chart shows the percentage distribution of the expenditure incurred in publishing a book. Study the pie-chart and the answer the question based on it.
For an edition of 12,500 copies, the amount of Royalty paid by the publisher is Rs. 2,81,250. What should be the selling price of the book if the publisher desires a profit of 5%?The Following Pie-chart Shows The Percentage Distribution Of...
  1.    Rs. 152.50
  2.    Rs. 157.50
  3.    Rs. 162.50
  4.    Rs. 167.50
 Discuss Question
Answer: Option B. -> Rs. 157.50
Answer: (b).Rs. 157.50
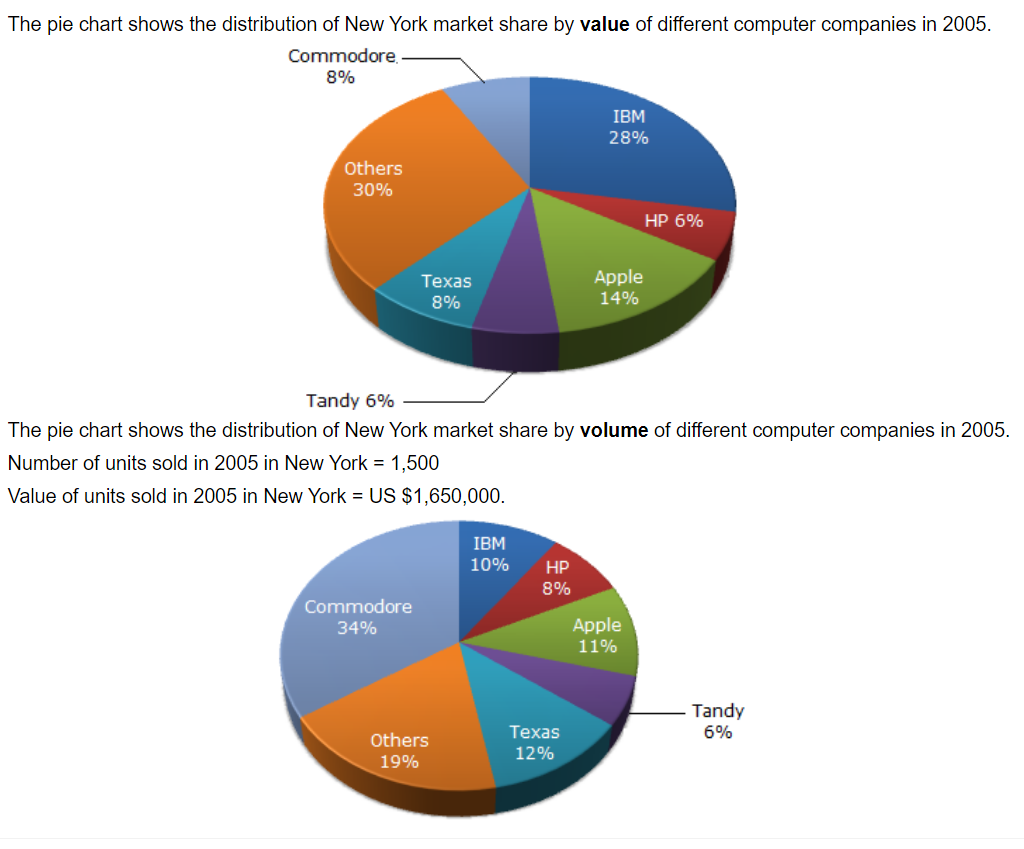
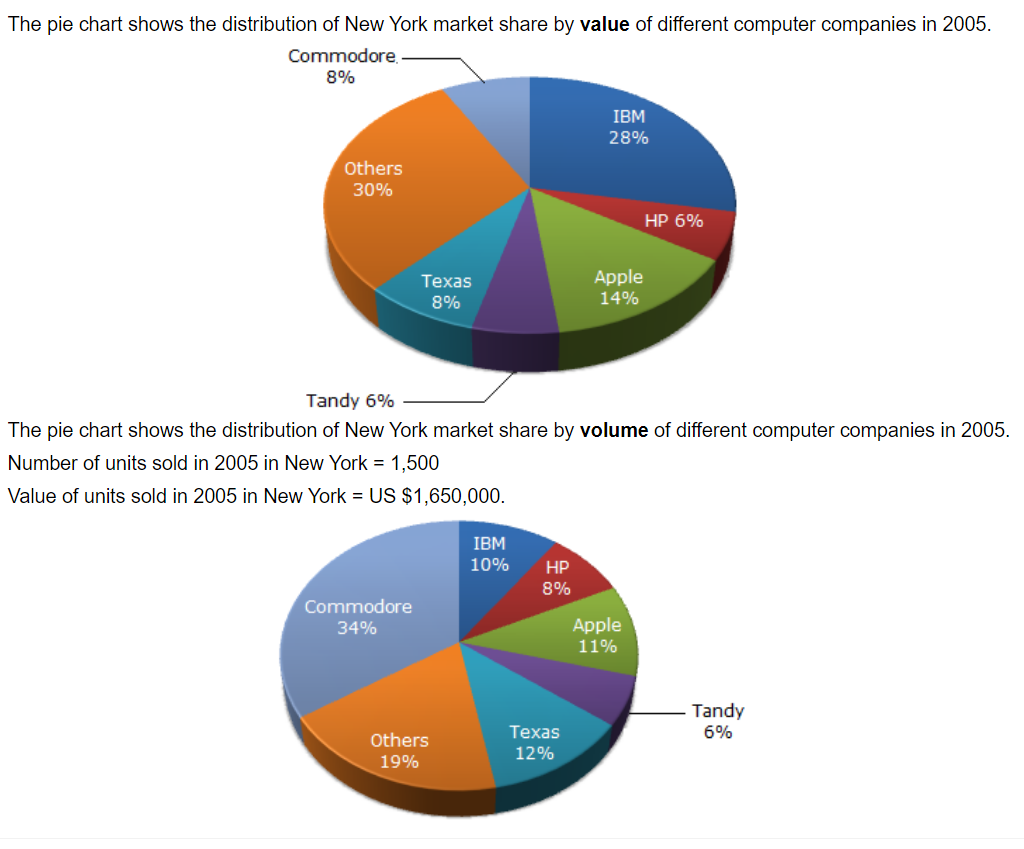
Question 49. Analyse the pie charts and answer the following question.
For the year 2005, which company has realised the lowest average unit sales price for a PC ?Analyse The Pie Charts And Answer The Following Question.For...
  1.    Commodore
  2.    IBM
  3.    Tandy
  4.    Cannot be determined
 Discuss Question
Answer: Option D. -> Cannot be determined
Answer: (d).Cannot be determined
Question 50. Analyse the pie charts and answer the following question.
In 2005, the average unit sale price of an IBM PC was approximately (in US$)Analyse The Pie Charts And Answer The Following Question.In ...
  1.    3180
  2.    2800
  3.    393
  4.    3080
 Discuss Question
Answer: Option D. -> 3080
Answer: (d).3080

Latest Videos

Latest Test Papers