7th Grade > Mathematics
DATA HANDLING MCQs
Total Questions : 114
| Page 3 of 12 pages
:
Formula: 1 Mark
Solution: 2 Marks
Mean=SumofobservationsNumberofobservations
Given, Mean = 11 and Number of observations = 7
∴11=Sumofobservation7
⇒ Sum of observations = 77
If each observation is multiplied by 2
New sum of observation is =77×2=144
∴ New Mean
=1447=22.57
:
Solution:1 Mark each
From the graph,
(a) Marks obtained by Pratik = 30
Marks obtained by Shubendu = 60
Difference of marks obtained by them = 60 - 30 = 30
(b)Marks obtained by Rohan = 30
Marks obtained by Gaurav = 50
Difference of marks obtained by them = 50 - 30 = 20
Question 23. (a) The following table gives the number of children grouped according to their favourite subjects :
Draw a bar graph using a suitable scale. [4 MARKS]
SubjectNo. of ChildrenEnglish32Hindi18Mathematics28Science40History36Geography26
(b) According to the graph, in which month is the number of people attending mass prayers maximum and in which month is the number of people attending lunch minimum?

Draw a bar graph using a suitable scale. [4 MARKS]
SubjectNo. of ChildrenEnglish32Hindi18Mathematics28Science40History36Geography26
(b) According to the graph, in which month is the number of people attending mass prayers maximum and in which month is the number of people attending lunch minimum?

:
Each part: 2 Marks
(a) Scale: x axis - Subjects
y axis - Number of children; 1 cm = 5 units
Bar graph :

(b)

As seen from the graph, the month in which the maximum number of people attended the mass prayer is in April because the blue bar is longest for the month of April. Similarly, the month in which the minimum number of people attended lunch is in March because the orange bar is shortest for the month of March.
:
Formula:1 Mark
Solution: 1 Mark
The whole pizza is divided into 8 slices.
⇒ Total number of slices= 8
Number of black piece = 1
The probability of drawing black slice:
=Number of black slicesTotal number of slices
P(E)=18.
:
Formula: 1 Mark
Solution: 2Marks
Total runs by batsman 'A' is 36 + 35 + 50 + 46 + 60 + 55 = 282
Total runs by batsman 'B' is 20 + 100 + 50 + 40 + 10 + 50 = 270
To find the mean, we find the sum of all the observations and divide it by the number of observations.
Mean=SumofallobservationTotalnumberofobservation
∴Meanforbatsman′A′=2826=47.
Thus, the mean runs scored by the batsman 'A' in an inning is 47.
Meanforbatsman′B′=2706=45.
Thus, the mean runs scored by the batsman 'B' in an inning is 45.
On an average batsman-A scored better than batsman-B.
:
The scale is read on the vertical axis. We can see that 1 division is 1 unit = 20 runs.
Question 28. (a) Arrange the plants in such a way that one plant acts as the dividing point and there are equal number of plants on either side of this dividing point.
The heights of the plants are: 5, 4, 132, 173, 142, 111, 123 (mm)
(b) You have to select the players for your football team. Which of the following given datasets will help you to take the decision?
Dataset 1. Name of the players
Dataset 2. Height of the players
Dataset 3. Stamina of players
Dataset 4. Nationality of the players
[3 MARKS]
:
Each part: 1 Mark
Steps: 1 Mark
(a) Since we have to chooseone plant which acts as the dividing point and there are equal number of plants on either side of this dividing point, we needto findthe median.
On arranging them in an ascending order we get,
4, 5, 111, 123, 132, 142, 173
The middle observation is123 mm.
⇒ The median of the observation is123 mm.
(b)The performance of a football player doesn't depend on his name or nationality. Performance solely depends on stamina and height. So, thedata sets which will help us take abetter decision are height and stamina of the players.
:
Each part: 1 Mark
(a) Arrange the data in ascending order
17, 18, 24, 25, 35, 36, 46.
Median is the middle observation.
Clearly, the middle observation is 25.
⇒ 25 is the median.
(b)Arrange the data in ascending order
87, 88, 88, 90, 92, 93, 95, 97, 98
Median is the middle observation.
⇒ 92 is the median.
Question 30. (i) The birth rate per thousand of different countries over a particular period of time is shown below:
INDIAU.K.CHINAGERMANYSWEDEN352242138
Draw a bar-graph. [4 MARKS]
(ii) A survey of a colony was done. The data is as following:
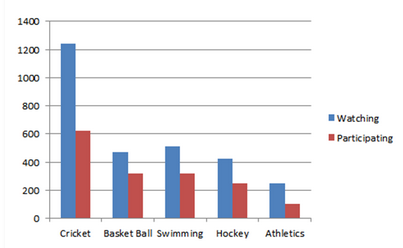
FavouriteSportCricketBasketBallSwimmingHockeyAthleticsWatching1240470510423250Participating620320320250105
a) Draw a double bar graph choosing an appropriate scale. What do you get from the bar graph?
b) Which sport is most popular?
c) Which is more preferred, watching or participating in sports?
:
Each part: 2 Marks
(i) Scale : x - axis - Countries
y - axis - Birth rate - 1 cm = 5 births

(ii) The given data is represented in a bar graph:

a) The bar graph represents the number of people who are watching and participating in their favourite sports.
b) Cricket is more popular.
c) Watching sports is more preferred.

![Click to Enlarge Image What Is The Scale Of The Bar Graph Shown Below? [1 MARK]](https://lakshyaeducation.in/quizpics/quiz/124091_98dbb535eac189170f3e00e7b9aa1d0309afc79720160630-5020-1mh188y.png)


