7th Grade > Mathematics
DATA HANDLING MCQs
Total Questions : 114
| Page 1 of 12 pages
Answer: Option A. -> 25
:
A
The difference between the highest and lowest observations is called range.
Largest integer=12.
Smallest integer=-13.
Range=12-(-13)=25.
:
A
The difference between the highest and lowest observations is called range.
Largest integer=12.
Smallest integer=-13.
Range=12-(-13)=25.
Question 2. A mathematics teacher wanted to see, whether the new technique of teaching she applied after the quarterly test was effective or not. She took the scores of the 5 weak children in the quarterly test (out of 25) and in the half-yearly test (out of 25): [4 MARKS]
StudentsAshishArunKavishMayaRitaQuarterly101512209Half yearly1518162115
Draw a double bar graph. Using the graph answer the following questions.
(i) Is the new technique of teaching effective?
(ii) Who has benefitted more from the new technique?
StudentsAshishArunKavishMayaRitaQuarterly101512209Half yearly1518162115
Draw a double bar graph. Using the graph answer the following questions.
(i) Is the new technique of teaching effective?
(ii) Who has benefitted more from the new technique?
:
Double bar graph: 2 Marks
Each part: 1 Mark
(i) Double bar graph :
Scale: y axis - 1 cm = 5 units

(i) Every student scored more in the half-yearly than the quarterly.
⇒ Newtechnique of teaching is effective.
(ii) The difference of marks scored by Rita in quarterly and half yearly is maximum.
⇒ Rita has benefitted more from thenew technique.
:
Formula: 1 Mark
Solution:1 Mark
Firstfive multiples of 5 are 5,10,15, 20 and 25.
Mean=Sum of all observationTotal number of observation
Mean=5+10+15+20+255=15
:
Mean, Median, Mode: Each 1 Mark
Mean=Sum of all observationTotal number of observation
⇒Mean=5+10+10+12+135=505=10
Median is the middle most observationof the given observations.
⇒Median=10
The mode is the most repeated observationof the given observations.
⇒Mode=10
Hence, for this observation, Mean, Median, Mode are equal.
Question 5. (a) The profits of a soft drink firm during certain months of a year are given alongside. Draw a Bar graph. [4 MARKS]
MonthsProfits (in thousands)January2.4February1.8March3.0April4.0May5.2June4.0July2.0
(b) The following bar graph shows the number of men and women visiting a sports complex. Can you spot the day when the number of men was equal to the number of women and on which day is the number of women 20 more than the number of men?

:
(a) 2 Marks
(b) 2 Marks
Scale : x - axis - Months
y - axis - Profits in thousands - 1 cm = 1 Thousand

(b)

Here, the height of the bar graph gives us the number of men and women. For Thursday, the height of both the graphs is same. So, on Thursday,the number of men was equal to the number of women.
On Monday the number of women is 20 more than the number of men. (No. of men = 40 ,No. of women = 60)
Question 6. Following table shows the points of each player scored in four games:
PlayerGameGameGameGame1234Suraj10161410Abhijit8046Harshith13Did not118Play
Based on the above table answer the following questions:
(i) Find the mean to determine Suraj's average number of points scored per game.
(ii) To find the mean number of points per game of Harshith, would you divide the total points by 3 or by 4? Why?
(iii) Abhijit played in all the four games. How would you find the mean?
(iv) Who is the best performer? [4 MARKS]
:
Solution: 1 Mark each
(i) Suraj's average number of points.
Mean=SumofallobservationTotalnumberofobservation
Mean=10+16+14+104=504
⇒Mean=12.5
(ii)To find the mean number of points per game of Harshith, mean should be divided by 3 because he played in only 3 games.
Mean=SumofallobservationTotalnumberofobservation
Mean=13+11+83=323
⇒Mean=10.66
(iii) For Abhijit's game mean is:
Mean=SumofallobservationTotalnumberofobservation
Mean=8+0+4+64=184
⇒Mean=4.5
(iv) Comparing everybody's mean score, Suraj has highest mean.
⇒ Suraj is best performer.
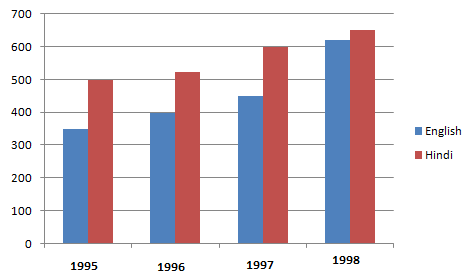
Question 7. Sale of English and Hindi books in the years 1995, 1996, 1997 and 1998 are given below:
Years1995199619971998English350400450620Hindi500525600650
Draw a double bar graph and answer the following questions:
(a) In which year was the difference in the sale of the two language books least?
(b) Can you say that the demand for english books increased? Justify. [4 MARKS]
Years1995199619971998English350400450620Hindi500525600650
Draw a double bar graph and answer the following questions:
(a) In which year was the difference in the sale of the two language books least?
(b) Can you say that the demand for english books increased? Justify. [4 MARKS]
:
Double Bar graph: 2 Marks
Answers:1 Mark each
Double bar graph:

(a) In the year 1998, the difference in the sale of the two language books was least.
(b) Yes, the demand for English books increased. From the graph, it is evident that the difference in the demand for English books from 1995 to 1998 is 620 - 350 = 270.
Whereas for Hindi books the difference is 650 - 500 = 150.
Comparatively, the demand for English books increased.
:
Given Data is: 2, 14, 16, 12, 14, 14, 16, 14, 10, 14, 18, 14.
Arranging the observations in the ascending order.
2, 10, 12, 14, 14, 14, 14, 14, 14, 16, 16, 18.
Clearly, the most repeated observation is 14.
⇒ 14 is mode.
Answer: Option C. -> 18
:
C
If there are 6 faces, the probability of getting one of 6 digits is 16. So, in the case of 8 faces, probability of getting any of the 8 numbers must be18.Hence, theprobability of getting 8 on throwing it is 18.
:
C
If there are 6 faces, the probability of getting one of 6 digits is 16. So, in the case of 8 faces, probability of getting any of the 8 numbers must be18.Hence, theprobability of getting 8 on throwing it is 18.
Answer: Option B. -> 23
:
B
After arranging the data in ascending order, we get:
0, 3, 8, 12, 15, 19, 23, 24, 39, 53, 57,64, 65.
Here, n = 13 = Odd
Median=(n+1)2th observation
=(13+1)2
=7thobservation
=23
Therefore, median of the given data is 23.
:
B
After arranging the data in ascending order, we get:
0, 3, 8, 12, 15, 19, 23, 24, 39, 53, 57,64, 65.
Here, n = 13 = Odd
Median=(n+1)2th observation
=(13+1)2
=7thobservation
=23
Therefore, median of the given data is 23.


