Question
(i) The birth rate per thousand of different countries over a particular period of time is shown below:
INDIAU.K.CHINAGERMANYSWEDEN352242138
Draw a bar-graph. [4 MARKS]
(ii) A survey of a colony was done. The data is as following:
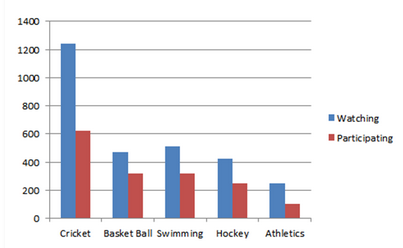
FavouriteSportCricketBasketBallSwimmingHockeyAthleticsWatching1240470510423250Participating620320320250105
a) Draw a double bar graph choosing an appropriate scale. What do you get from the bar graph?
b) Which sport is most popular?
c) Which is more preferred, watching or participating in sports?
Answer:
:
Each part: 2 Marks
(i) Scale : x - axis - Countries
y - axis - Birth rate - 1 cm = 5 births

(ii) The given data is represented in a bar graph:

a) The bar graph represents the number of people who are watching and participating in their favourite sports.
b) Cricket is more popular.
c) Watching sports is more preferred.
Was this answer helpful ?
:
Each part: 2 Marks
(i) Scale : x - axis - Countries
y - axis - Birth rate - 1 cm = 5 births

(ii) The given data is represented in a bar graph:

a) The bar graph represents the number of people who are watching and participating in their favourite sports.
b) Cricket is more popular.
c) Watching sports is more preferred.
Was this answer helpful ?


Submit Solution