7th Grade > Mathematics
DATA HANDLING MCQs
Total Questions : 114
| Page 2 of 12 pages
Answer: Option A. -> 38.5
:
A
When you arrange the datain ascending order, you get:
6 9 12 19 23 34 43 54 56 69 74 87
If number of observations is odd then median is the(n2)th term
Ifit is even then median is the mean of the (n2)th and(n2)+1) th term.
Here the numberof observations is 12 - even,
Therefore, the median will be an average of 6thand 7thobservation.
So, Median=34+432=772=38.5.
Answer: Option C. -> Abibas
:
C
Average star rating = Total number of stars given by peopleTotal number of people who gave the rating.
For Ruma,average star rating = 180×5+104×4+95×3+12×2+11×1180+104+95+12+11 = 4.07
For Peebok,average star rating = 150×5+110×4+87×3+22×2+23×1150+110+87+22+23 = 3.87
For Abibas,average star rating = 234×5+98×4+88×3+16×2+18×1234+98+88+16+18 = 4.13
4.13> 4.07> 3.87
So,Abibas has the highest rating.
Answer: Option B. -> 1-c , 2-d , 3-b , 4-e , 5-a
:
B
As seen from the graph,
the quantity of apples sold = 5 kg,
the quantity of mangoessold= 15 kg,
the quantity of bananas sold = 20 kg,
the quantity of pineapples sold = 10 kg and
the quantity of papayas sold = 25 kg.
Thus, 1 - c,2 - d,3 - b,4 - e,5 - a is correct.
:
B
As seen from the graph,
the quantity of apples sold = 5 kg,
the quantity of mangoessold= 15 kg,
the quantity of bananas sold = 20 kg,
the quantity of pineapples sold = 10 kg and
the quantity of papayas sold = 25 kg.
Thus, 1 - c,2 - d,3 - b,4 - e,5 - a is correct.
Question 14. There is a data set with 1000 observations. Out of these observations, the observation that occurs most frequently is 9, which occurs 13 times. After taking 20 more observations, it was observed that 13, which was not there in the observations before, occurred 19 out of 20 times and 9 occurred only 1 out of 20 times. What is the mode in these 1020 observations?
___
___
:
In the 1000 observations, 9 will be the mode.
In 1020 observations, frequency of 9 = 13 + 1 = 14
In 1020 observations, frequency of 13 = 19
So, mode of the observations = 13.
Answer: Option C. -> 6.5
:
C
Arranged data set is:
1 4 6 6 9 12 13 19 25 33 45 56
Median: The middle most value after arranging the given data.
Here, the number of observations is 12, which is an even number.So, we take the average of thetwo observations in the middle to find the value of median.
Median=12+132=12.5. (Mean of the 6th and7th observation)
Mode:Theobservation that occurs most often in the data set.
We can find 6 two times in the data set. This is the most repeated value in the data set. The value of the mode is 6.
i.e., Mode=6.
Difference betweenmedian and mode of the given data set=12.5-6=6.5.
Answer: Option B. -> the data which lies in the middle of an organised data set.
:
B
Median is defined as the data which lies in the middle of an organised data set. Median refers to the value which lies in the middle of the data (when arranged in an increasing or decreasing order) with half of the observations above it and the other half below it.
:
B
Median is defined as the data which lies in the middle of an organised data set. Median refers to the value which lies in the middle of the data (when arranged in an increasing or decreasing order) with half of the observations above it and the other half below it.
Answer: Option C. -> 85
:
C
Average =Total marksTotal number of student
65=3080+Marks scoredbyArjun+Marksscored by Karan50.
Since marks scored by Arjun =Marks scored by Karan
Marks scored by Arjun +Marks scored by Karan =2 × Marks scored by Arjun.
So, 65 × 50 = 3080 + 2 × Marks scored by Arjun.
So, marks scored by Arjun =3250−30802=1702=85 marks.
Answer: Option B. -> Mode
:
B
Mean and Range may or may not be equal to any of the observations from the data set. Median is one of the observations if the number of observations is odd. If it's even, median also won't be equal to one of the observations. But mode is always equal to one of the observations.
:
B
Mean and Range may or may not be equal to any of the observations from the data set. Median is one of the observations if the number of observations is odd. If it's even, median also won't be equal to one of the observations. But mode is always equal to one of the observations.
Question 19. Given below is the table of the marks of 10 students. For getting promoted to section A, a student has to score more marks than the average. Can you tell me from the given options, which student will not be promoted to Section A?
NameMarksNameMarksPavani79Ajit77Goutham81Kushagra73Deepthi68Manish94Pavan85Satyam81Akash62Sarosh80
NameMarksNameMarksPavani79Ajit77Goutham81Kushagra73Deepthi68Manish94Pavan85Satyam81Akash62Sarosh80
Answer: Option C. -> Deepthi
:
C
We know that,
Average=SumofallobservationsTotalnumberofobservations
Average marks=79+81+68+85+62+77+73+94+81+8010=78010=78.
Students who scored less marks than the average, won't be promoted to section A. So, from the given options, only Deepthi has lesser marks than 78.
:
C
We know that,
Average=SumofallobservationsTotalnumberofobservations
Average marks=79+81+68+85+62+77+73+94+81+8010=78010=78.
Students who scored less marks than the average, won't be promoted to section A. So, from the given options, only Deepthi has lesser marks than 78.
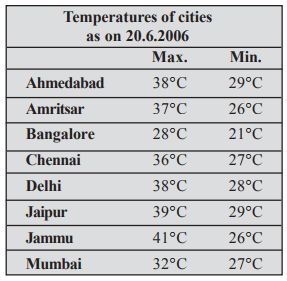
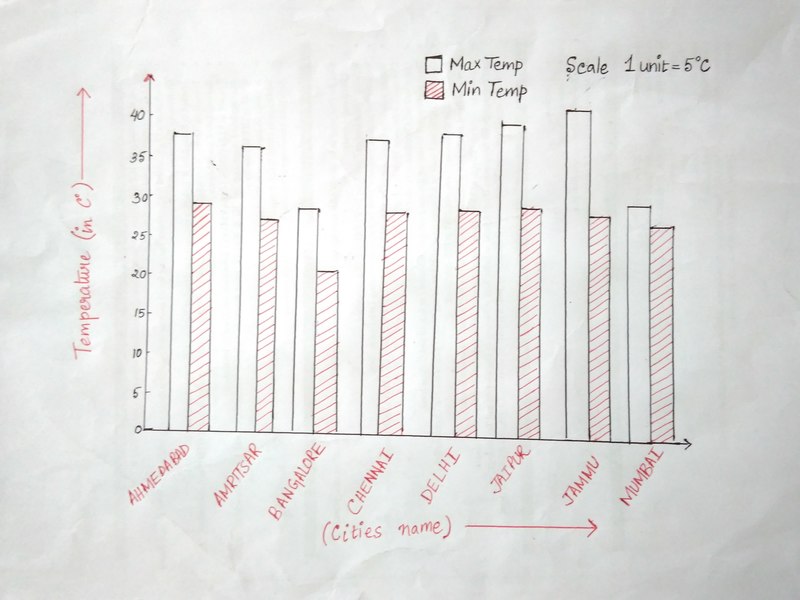
Question 20. Plot a double bar graph using the given data and answer the following: [4 MARKS]

(i) Which city has the largest difference in the minimum and maximum temperature?
(ii) Which is the hottest city and which is the coldest city?
(iii) Name two cities where maximum temperature of one was less than the minimum temperature of the other.
(iv) Name the city which has the least difference between its minimum and the maximum temperature.
:
Drawing double bar graph: 2 Marks
Each part: 0.5 Marks
⇒ Data represented by double bar graph is as follows:

(i) Jammu has the largest difference in temperature i.e., Maximum temperature = 41∘Cand Minimum temperature = 26∘C
∴ Difference = 41∘C–26∘C=15∘C
(ii) Jammu is the hottest city as the maximum temperature is the highest among all the given cities and Bangalore is the coldest city because theminimum temperature there is lowest among all the given cities.
(iii) Maximum temperature of Bangalore = 28∘C
Minimum temperature of two cities whose minimum temperature is higher than the maximum temperature of Bangalore are Ahmedabad and Jaipur = 29∘C
(iv) Mumbai has the least difference in temperature i.e., Maximum temperature = 32∘C and Minimum temperature = 27∘C.
∴ Difference = 32∘C–27∘C=5∘C


