7th Grade > Mathematics
DATA HANDLING MCQs
Total Questions : 114
| Page 4 of 12 pages
:
Each part: 1 Mark
The arithmetic mean is,
Mean=Sum of all observationsTotal number of observations
(a) Mean=2+3+4+5+6+7+8+98
⇒Mean=448=5.5
(b)Mean=12+13+14+15+16+17+18+19+208
⇒Mean=1449=16
:
Formula: 1 Mark
Result:1 Mark
Range is defined as the difference between the highest and the lowest observation.
Here, after arranging marks inascending order : ( -6 ),( -1 ) , 0 , 2, 8 , 12 , 14 , 15.
Lowest observation: (-6)
Highest observation: 15
Range = Highest observation -Lowest observation
Range = 15 - (-6) = 21
:
Formula: 1 Mark
Result:1 Mark
Mean=Sum of all observationTotal number of observation
Mean=9+10+8+9+12+106=9.66.
The mean is 9.66.
Question 34. The rainfall (in mm) in a city on 7 days of a certain week was recorded as follows:
DayMonTueWedThursFriSatSunRainfall0.012.22.10.020.55.51.0(in mm)
(i) Find the range of the rainfall in the above data.
(ii) Find the mean rainfall for the week.
(iii) On how many days was the rainfall less than the mean rainfall? [4 MARKS]
DayMonTueWedThursFriSatSunRainfall0.012.22.10.020.55.51.0(in mm)
(i) Find the range of the rainfall in the above data.
(ii) Find the mean rainfall for the week.
(iii) On how many days was the rainfall less than the mean rainfall? [4 MARKS]
:
Range: 1 Mark
Mean: 2 Marks
Answer: 1 Mark
(i) Range = Highest observation -Lowest observation
Range = 20.5 - 0.0 = 20.5
(ii)Mean=SumofallobservationTotalnumberofobservation
Mean=0.0+12.2+2.1+0.0+20.5+5.5+1.07
Mean=41.37=5.9
(iii) On Mon, Wed, Thurs, Sat, and Sun the rainfall was less than mean rainfall i.e. 5.9 mm.
⇒ On 5 daysthe rainfall was less than the mean rainfall.
:
Formula: 1 Mark
Application: 1 Mark
Calculation: 1 Mark
Here, we have 8 cardsA, E, I,O,U,B, G, H
Vowels = A, E, I, O, U
⇒ Number of vowel cards = 5
So, probability of drawing vowel
P(E)=No.of vowelsTotal number of cards=58
Consonants = B, G, H
⇒ Number ofConsonant cards = 3
Probability of drawing consonant:
P(E)=No.of consonantsTotal number of cards=38
:
Steps: 1 Mark
Result:1 Mark
Given runs are,12, 32, 43, 32, 12, 32, 12, 32, 36, 54,11.
Arranging the numbers in ascending order:
11, 12, 12, 12, 32, 32, 32, 32, 36, 43, 54.
Mode of a set of observations is the observation which occurs most often.
Clearly, here, 32 runs are scored by most of the batsman.
So, the mode of the observation is32.
:
Formulas: 1 Mark
Each part: 1 Mark
(i) Arranging the ages in ascending order, we get:
25, 28, 30, 34, 35, 37, 40, 42, 43, 56
We find that the age of the oldest teacher is 56 years and the age of the youngest teacher is 25 years.
Range of the ages of the teachers = (56 - 25) years = 31 years
(ii) Mean age of the teachers:
=25+28+30+34+35+37+40+42+43+5610years
=37010years=37years
:
Steps: 2 Marks
Result: 1 Mark
Given,
Weights of 9 different students : 54kg, 56kg , 54kg , 57kg , 54kg , 52kg , 54kg , 55kg , 59kg
Arranging the data in ascending order,
52kg,54kg,54kg,54kg,54kg,55kg,56kg,57kg,59kg
Median is the middle most observationof the given observations
⇒ Median = 54kg
Mode is the most repeatedobservationof the given observations
Clearly, 54kg is the mostrepeated observation
⇒ Mode = 54kg
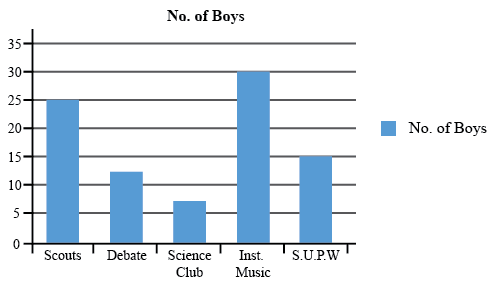
Question 39. (a) The number of boys taking part in different extracurricular activities is shown in the table given below. Represent the data on a bar graph. [4 MARKS]
ActivitiesNo. of boysScouts25Debate13Science Club7Inst. Music30S.U.P.W15
(b) What is the difference between the number of mangoes sold on Sunday and the number of custard apples sold on Wednesday?

ActivitiesNo. of boysScouts25Debate13Science Club7Inst. Music30S.U.P.W15
(b) What is the difference between the number of mangoes sold on Sunday and the number of custard apples sold on Wednesday?

Answer: Option C. -> BATMAN, 3
:
C
Average=SumofallobservationsTotalnumberofobservations
Here, for both the cases, the total number of observations is the same and it is7.
Average number of villians caught by Batman per day = 2+5+4+1+3+2+47 = 217 = 3.
Average number of villians caught by Superman per day =3+4+2+2+1+2+07 = 147 = 2.
So, BATMAN's average is higher and it is 3.

![Click to Enlarge Image Following Cards Are Facing Down: [3 MARKS]Find The Probabil...](https://lakshyaeducation.in/quizpics/quiz/content_5.jpg)


