Question
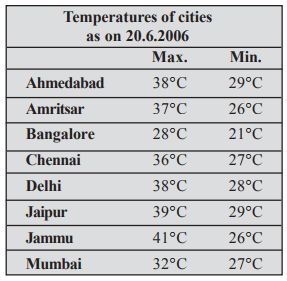
Plot a double bar graph using the given data and answer the following: [4 MARKS]

(i) Which city has the largest difference in the minimum and maximum temperature?
(ii) Which is the hottest city and which is the coldest city?
(iii) Name two cities where maximum temperature of one was less than the minimum temperature of the other.
(iv) Name the city which has the least difference between its minimum and the maximum temperature.
Answer:
:
Drawing double bar graph: 2 Marks
Each part: 0.5 Marks
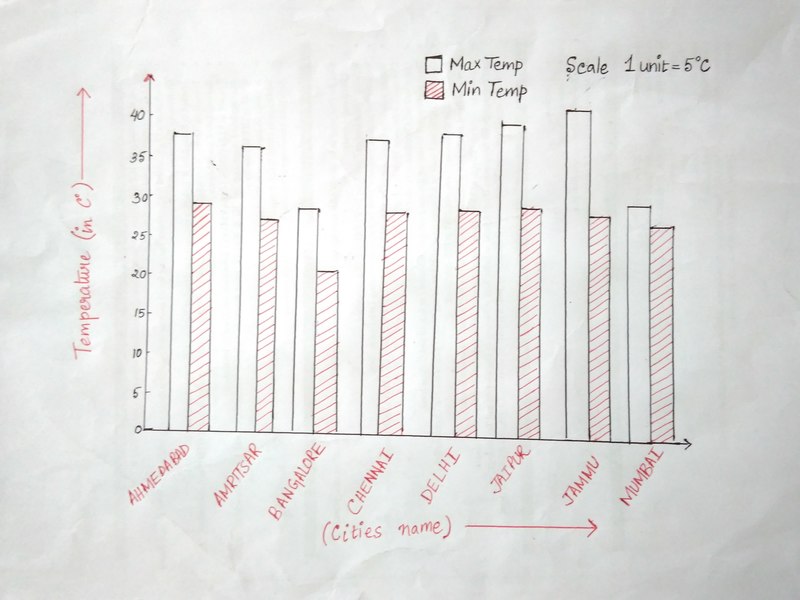
⇒ Data represented by double bar graph is as follows:

(i) Jammu has the largest difference in temperature i.e., Maximum temperature = 41∘Cand Minimum temperature = 26∘C
∴ Difference = 41∘C–26∘C=15∘C
(ii) Jammu is the hottest city as the maximum temperature is the highest among all the given cities and Bangalore is the coldest city because theminimum temperature there is lowest among all the given cities.
(iii) Maximum temperature of Bangalore = 28∘C
Minimum temperature of two cities whose minimum temperature is higher than the maximum temperature of Bangalore are Ahmedabad and Jaipur = 29∘C
(iv) Mumbai has the least difference in temperature i.e., Maximum temperature = 32∘C and Minimum temperature = 27∘C.
∴ Difference = 32∘C–27∘C=5∘C
Was this answer helpful ?
:
Drawing double bar graph: 2 Marks
Each part: 0.5 Marks
⇒ Data represented by double bar graph is as follows:

(i) Jammu has the largest difference in temperature i.e., Maximum temperature = 41∘Cand Minimum temperature = 26∘C
∴ Difference = 41∘C–26∘C=15∘C
(ii) Jammu is the hottest city as the maximum temperature is the highest among all the given cities and Bangalore is the coldest city because theminimum temperature there is lowest among all the given cities.
(iii) Maximum temperature of Bangalore = 28∘C
Minimum temperature of two cities whose minimum temperature is higher than the maximum temperature of Bangalore are Ahmedabad and Jaipur = 29∘C
(iv) Mumbai has the least difference in temperature i.e., Maximum temperature = 32∘C and Minimum temperature = 27∘C.
∴ Difference = 32∘C–27∘C=5∘C
Was this answer helpful ?


Submit Solution