Sail E0 Webinar

9th Grade > Mathematics

STATISTICS MCQs

Total Questions : 53 | Page 4 of 6 pages
Question 31.


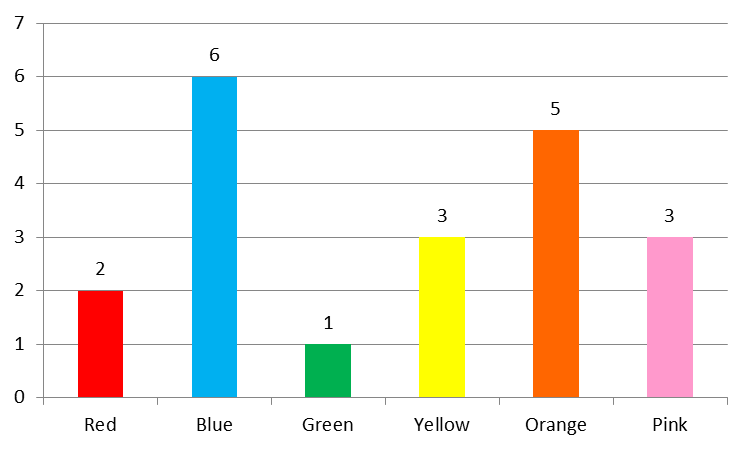
The following bar graph shows the favourite colours of 20 students of a class.
 The Following Bar Graph Shows The Favourite Colours Of 20 St...
From the graph, it can be inferred that


  1.     Blue is the favourite colour of most students.
  2.     Red is the favourite colour of the least of the students.
  3.     Orange is the second most popular colour.
  4.     Pink and green are equally liked.
 Discuss Question
Answer: Option A. -> Blue is the favourite colour of most students.
:
A and C
From the graph, it can be observed that:
Frequency of Blue = 6
Frequency of Orange=5
Frequency of Yellow=3
Frequency of Pink=3
Frequency of Red=2
Frequency of Green=1
Therefore, blue is most favoured colour and orange is second most favoured colour. Thus, options A and C are correct. The least favoured colour is green so option B is incorrect. Also the frequency of green and pink are different. So option D is also incorrect.
Question 32.


The difference between the highest and the lowest values in the given data is called the 'range' of the data. 


  1.     True
  2.     False
  3.     152
  4.     150
 Discuss Question
Answer: Option A. -> True
:
A

The difference between the highest and the lowest values in the data is called the 'range' of the data.
For example,
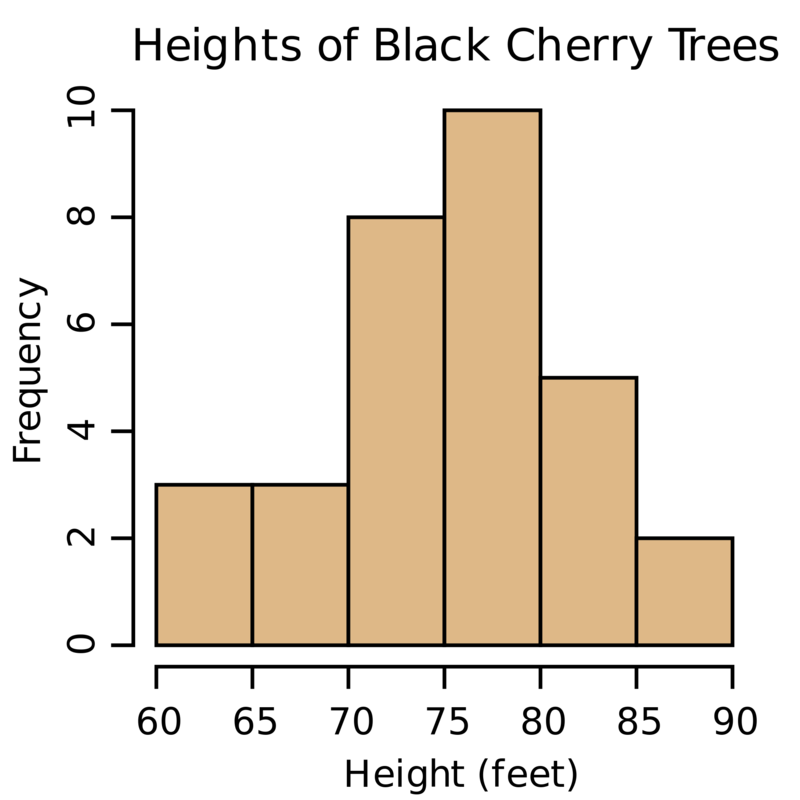
In the following graph, the range of the height of trees
is 90 - 60 = 30 feet.
 The Difference Between the Highest And The Lowest Values In...


Question 33.


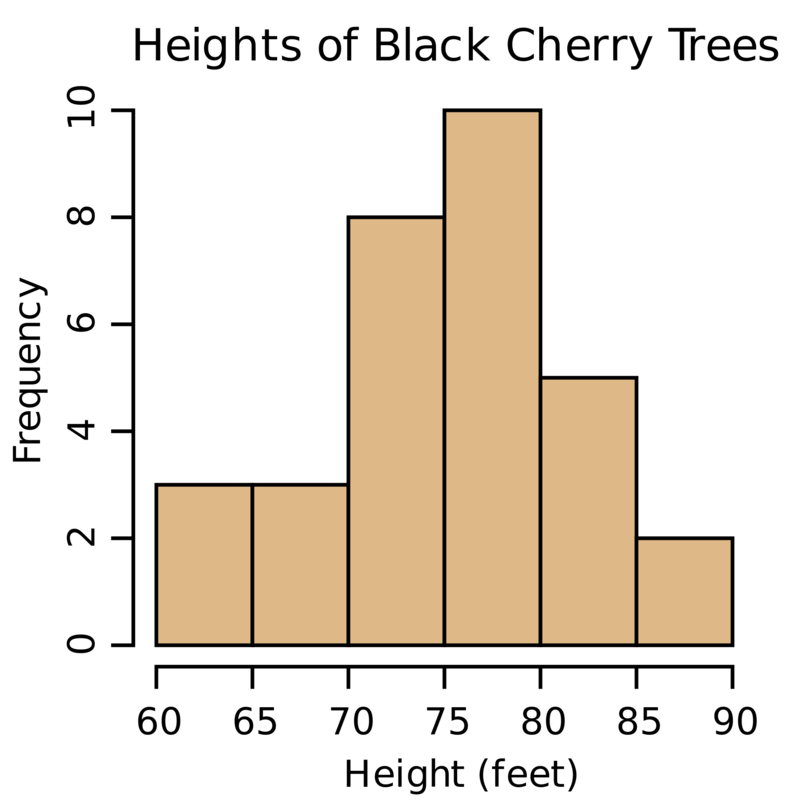
The figure below shows a histogram of heights of cherry trees. Find the correct statement(s) among the options.
The Figure Below Shows A Histogram Of Heights Of Cherry Tree...


  1.     Total number of trees is 31
  2.     The most common range of height of trees is 70-75 feet
  3.     Least common range of height is 85-90 feet
  4.     Total number of trees is 32
 Discuss Question
Answer: Option A. -> Total number of trees is 31
:
A and C
If we add the frequencies of all the bars, total number of trees=3+3+8+10+5+2=31
The highest bar belongs to the range of 75-80 feet. So, the most common range of height is 75-80 feet.
The shortest bar belongs to the range of 85-90 feet. So, the least common range of height is 85-90 feet.
 
Question 34.


Which of the following is/are a measure of central tendency?


  1.     Frequency
  2.     Median
  3.     Mean
  4.     Class Limit
 Discuss Question
Answer: Option B. -> Median
:
B and C

Mean, median and mode are used as measures of central tendency. Mean is the average of all the observations, mode is the observation having maximum frequency and median is the value which divides the data into two equal halves. 


Question 35.


What is the median of the following data: 1, 4, 7, 3, 9, 5, 3, 2, 7, 5.


  1.     4
  2.     4.5
  3.     5
  4.     7
 Discuss Question
Answer: Option B. -> 4.5
:
B

For finding the median, the data should be arranged in ascending or descending order first.
Arranging the data in ascending order ,we get :
1, 2, 3, 3, 4, 5, 5, 7, 7, 9.
There are even number of observations.
Hence the  median is the mean value of (n2)th and [(n2)+1]th term. 
Here the 102thterm= 5th term = 4
[(n2)+1]th term.  = 6th term = 5
 i.e. (4+52)=4.5
Hence, median of the given data =4.5


Question 36.


The mode of the given data 7, 9, 11, 13, 9 13, 9, 9, 7, 8 is 


___
 Discuss Question
Answer: Option B. -> 4.5
:

Mode is that value of the observation which occurs most frequently i.e. an observation with maximum frequency is called mode. In the above set of observations, '9' occurs most frequently and so it is the mode of the given data.


Question 37.


Find the range of the following data: 26, 21, 33, 17, 14, 15, 27.


  1.     13
  2.     15
  3.     17
  4.     19
 Discuss Question
Answer: Option D. -> 19
:
D

The difference between the highest and lowest values in the data is called the 'range' of the data. So, here the maximum value is 33 and the minimum is 14. So the difference between them i.e. 19 is the range of the given data.


Question 38.


The mean of 15 observations is 8. If the mean of the first eight observations is 7 and that of the last eight observations is 10, then the value of the 8th observation is _____.


  1.     16
  2.     15
  3.     14
  4.     13
 Discuss Question
Answer: Option A. -> 16
:
A

We know that,
Mean = Sum of all observationsNumber of observations
Sum of values of all the observations
=Mean×Number of observation
=15×8
=120
So, sum of the first eight observations
=Mean×Number of observation
=7×8
=56
Sum of the last eight observations
=Mean×Number of observation
=10×8
=80 

Hence, value of the 8thobservation 
=(80+56)120
=16


Question 39.


The graph below shows the ages of presidents of a country at the time of inauguration or start of their tenure. 
The Graph Below Shows The Ages Of Presidents Of A Country At...
Find the correct option(s) among the following.


  1.     The total number of presidents is 45.
  2.     The youngest president was 44 years old
  3.     The youngest president was 39 years old.
  4.     The oldest president is 74 years old.
 Discuss Question
Answer: Option B. -> The youngest president was 44 years old
:
B
On summing up all the frequencies, we get 4+11+14+9+4+2=44. Hence the total number of presidents is 44 and option A is incorrect. The graph starts from 39 but the corresponding frequency is 0. Hence, the age of 44 is the youngest age of president. Thus, B is correct and C is incorrect. The last point on the graph having non-zero frequency is 69. 74 has zero frequency and hence option D is incorrect.
Question 40.


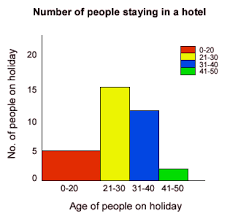
The graph below shows the number of people of different age groups staying in a hotel. Find the correct statement(s) among the options. 
The Graph Below Shows The Number Of People Of Different Age ...


  1.     Total number of people in 0-20 age group is 10
  2.     Total number of people in 0-20 age group is 5
  3.     Maximum number of people are from age group of 21-30 years
  4.     Total number of people staying in the hotel is 35
 Discuss Question
Answer: Option A. -> Total number of people in 0-20 age group is 10
:
A and C

The number of people in a class is proportional to area.
Therefore, the class of 0-20 is twice the size of other classes.
So, total frequency of 0-20 class is  5×2=10


Hence option A is correct and B is incorrect. 
The class of 21-30 age group has the highest frequency. 
Hence option C is correct.
On summing up all the frequencies, it can be seen that D is incorrect


Latest Videos

Latest Test Papers