Question
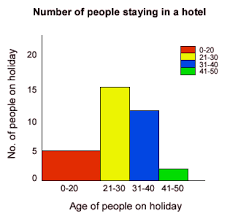
The graph below shows the number of people of different age groups staying in a hotel. Find the correct statement(s) among the options. 
Answer: Option A
:
A and C
Was this answer helpful ?
:
A and C
The number of people in a class is proportional to area.
Therefore, the class of 0-20 is twice the size of other classes.
So, total frequency of 0-20 class is 5×2=10
Hence option A is correct and B is incorrect.
The class of 21-30 age group has the highest frequency.
Hence option C is correct.
On summing up all the frequencies, it can be seen that D is incorrect
Was this answer helpful ?


Submit Solution