Sail E0 Webinar

9th Grade > Mathematics

STATISTICS MCQs

Total Questions : 53 | Page 3 of 6 pages
Question 21. The height of 10 students in a class are (in cm):-
135, 143, 132, 149, 150, 143, 158, 124, 143, 152
Find the mode.
  1.    135
  2.    143
  3.    152
  4.    150
 Discuss Question
Answer: Option B. -> 143
:
B
We know that,
The mode of a set of observations is the observation that occurs most often.
We arrange the given data in the following way:
124, 132, 135, 143, 143, 143, 149, 150, 152 ,158 .
We see that in the above observation 143 is the height of themaximum number of students.
Hence, the mode of the given data is 143.
Question 22. The difference between the highest and the lowest values in the given data is called the 'range' of the data. 
  1.    True
  2.    False
  3.    152
  4.    150
 Discuss Question
Answer: Option A. -> True
:
A
The difference betweenthe highest and the lowest values in the data is called the 'range' of the data.
For example,
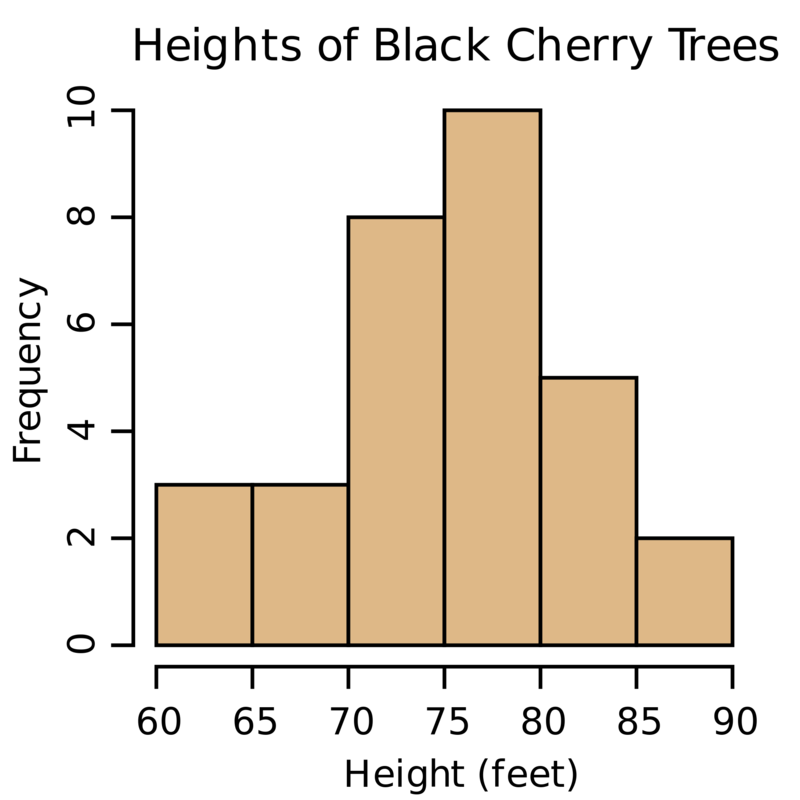
In the following graph, the range of the height of trees
is 90 - 60 = 30 feet.
The Difference Between the Highest And The Lowest Values In...
Question 23. State true or false.
To draw a frequency polygon, we have to first draw a histogram.
  1.    False
  2.    True
  3.    152
  4.    150
 Discuss Question
Answer: Option A. -> False
:
A
State True Or False.To Draw A Frequency Polygon, We Have To ...
We don't need to draw a histogram in order to draw a frequency polygon. We can obtain the class mark corresponding to each class interval, which corresponds to the midpoint of the class interval along the x-axis and the corresponding frequency along the y-axis.The lines joining these points will constitute the frequency polygon.
Question 24.


The mean of the following distribution is:
xi10131619fi2576


  1.     15.2
  2.     15.35
  3.     15.55
  4.     16
 Discuss Question
Answer: Option C. -> 15.55
:
C

We know that,
Average or mean value of a given number of observations is the sum of all the observations divided by the total number of observations. 
Mean=xififi
 Now,
xifi=20+65+112+114=311
 fi=20
 So,
 Mean=xififi=31120=15.55


Question 25.


Find the value of 'p' if the mean of the following data is 17.
xi10p182125fi1015799 


  1.     12
  2.     14
  3.     16
  4.     18
 Discuss Question
Answer: Option B. -> 14
:
B

Average or mean value of a given number of observations is the sum of all the observations divided by the total number of observations. 


xi10p182125fi1015799xifi10015p126189225
  Mean =xififi
xifi = 100 + 15p + 126 + 189 + 225
             = 640 + 15p


    fi = 50


given that mean = 17


640 + 15p = 50 x 17
            15p = 210
               p = 14


Question 26.


The height of 10 students in a class are (in cm):-
135, 143, 132, 149, 150, 143, 158, 124, 143, 152
Find the mode.


  1.     135
  2.     143
  3.     152
  4.     150
 Discuss Question
Answer: Option B. -> 143
:
B
We know that,
The mode of a set of observations is the observation that occurs most often.
We arrange the given data in the following way:
124, 132,  135,  143, 143,  143,  149, 150,  152 , 158 .
We see that in the above observation 143 is the height of the maximum number of students.
Hence, the mode of the given data is 143.

Question 27.


The size of the interval in a data table depicting the entities contained in it is known as


  1.     Class mark
  2.     Class height
  3.     Class interval
  4.     Range
 Discuss Question
Answer: Option C. -> Class interval
:
C

Class interval or class size is basically the size of the interval which depicts the entities contained in it.


Question 28.


State true or false.
To draw a frequency polygon, we have to first draw a histogram.


  1.     False
  2.     True
  3.     152
  4.     150
 Discuss Question
Answer: Option A. -> False
:
A

State True Or False.To Draw A Frequency Polygon, We Have To ...
We don't need to draw a histogram in order to draw a frequency polygon. We can obtain the class mark corresponding to each class interval, which corresponds to the midpoint of the class interval along the x-axis and the corresponding frequency along the y-axis. The lines joining these points will constitute the frequency polygon.


Question 29.


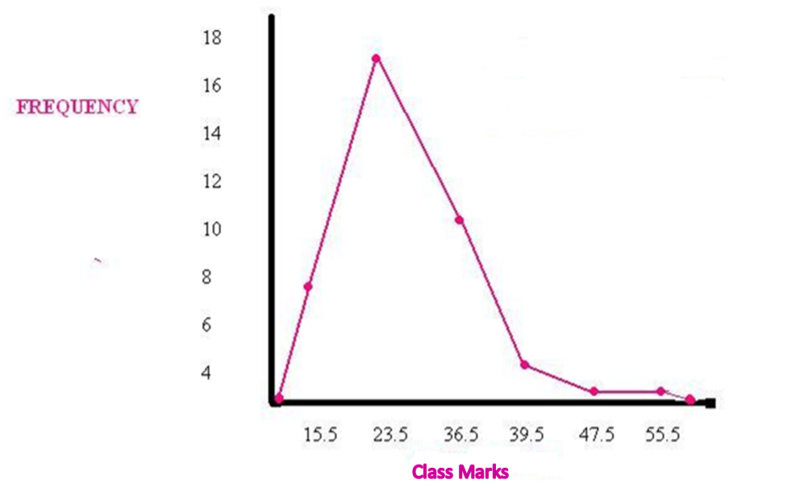
The frequency polygon below shows marks obtained by students of a class. 
The Frequency Polygon Below Shows Marks Obtained By Students...
From the graph, it can be said that the maximum number of students have scored marks between ____.


  1.     55-65 
  2.     50-60 
  3.     60-70
  4.     60 
 Discuss Question
Answer: Option A. -> 55-65 
:
A
The peak of the frequency polygon corresponds to 60 marks. 60 is the class mark of class 55-65. Hence the class 55-65 has the maximum number of students.
Question 30.


The table below shows the sale of shirts of various sizes in a week.


Shirt size3839404142Number sold6073899023
The size which is demanded the most is 


___.
 Discuss Question
Answer: Option A. -> 55-65 
:

The frequencies of different observations are given in the table.


It can be seen that shirts of size 41 have the maximum frequency of 90.


So, the mode is 41 and size 41 is the size most in demand.


Latest Videos

Latest Test Papers