Question
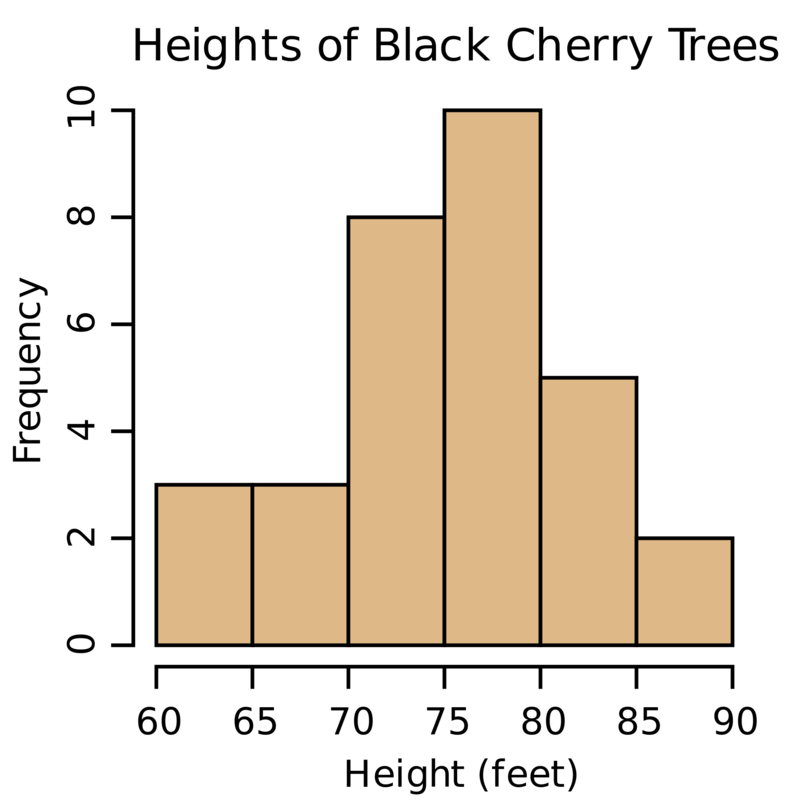
The figure below shows a histogram of heights of cherry trees. Find the correct statement(s) among the options.
Answer: Option A
:
A and C
If we add the frequencies of all the bars, total number of trees=3+3+8+10+5+2=31
The highest bar belongs to the range of 75-80 feet. So, the most common range of height is 75-80 feet.
The shortest bar belongs to the range of 85-90 feet. So, the least common range of height is 85-90 feet.
Was this answer helpful ?


Submit Solution